On-Line TOC System used to Monitor RO Performance
By KAREN A. CLARK
Reverse osmosis (RO) membranes are gaining acceptance as a final treatment step for wastewater reuse systems. To prevent the transmission of waterborne diseases, reclaimed water is controlled by stringent regulations specifying wastewater treatment processes, nutrient removal, final effluent quality and disinfection criteria based on the specific reuse application.
RO membranes have the potential for the removal of all pathogens and TOC. Since they provide the ultimate barrier between the consumer and pathogenic microbes in wastewater reuse, it is vital that the membrane barrier remain intact. There has been limited data available on methods used to evaluate RO membrane integrity and performance. In addition, the availability of accurate and sensitive real time monitoring methods has raised concerns.
The two most common techniques to monitor RO systems are on-line particle counting and conductivity. The sensitivity of particle counting is limited to the concentration and size of particles in the RO feed and effluent streams. On-line conductivity measurements can provide a greater degree of sensitivity than particle counting, but high levels of TOC and ultimately pathogens, which are carbon-based species, can break through without any changes to the water's conductivity.
TOC analysis is a more direct approach to RO water quality information. Older TOC laboratory methods are too time consuming and do not provide real time data. However, on-line TOC monitoring is a real time analysis tool that can provide the best degree of sensitivity to detect RO membrane compromises and report a quantifiable water quality parameter.
Methodology
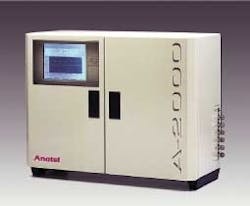
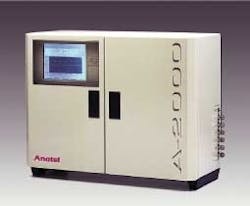
TOC analysis involves the oxidation of carbon and the detection of the resulting carbon dioxide. Analytical methods approved by the Environmental Protection Agency (EPA) for measuring total organic carbon in drinking water include Standard Methods 5310B, 5310C and 5310D. In a recent study, an Anatel A-2000 Wide-Range TOC Analyzer, equipped with an autosampler, was used to monitor RO performance.
The analyzer measures TOC in accordance with Standard Method 5310C. It measures TOC directly by adding phosphoric acid to the water sample to reduce the pH to approximately 2 to 3. At this low pH any inorganic carbon present is liberated as CO2 into a nitrogen carrier gas and is directly measured by a non-dispersive infrared (NDIR) detector. Any remaining carbon in the sample is assumed to be TOC.
A sodium persulfate oxidant is then added to the sample, and in the presence of UV radiation, the remaining carbon is oxidized to CO2. The amount of CO2 generated is measured by the NDIR to determine the amount of TOC originally present in the water. The TOC analyzer has three operating ranges, 20 ppb to 10,000 ppb, 1 ppm to 100 ppm and 100 ppm to 1000 ppm. For the purpose of this study, the TOC analyzer was operated in the 20 ppb to 10,000 ppb range.
Experimental
The TOC analyzer was installed at a pilot wastewater treatment plant intended for reclamation. The plant was designed to take tertiary treated wastewater, essentially salty reclaimed water, and treat it to potable quality. The tertiary wastewater was fed to a low pressure membrane, Microfiltration (MF) or Ultrafiltration (UF). The effluent from the MF or UF proceeded to a bank of reverse osmosis membranes.
In order to remove nitrate and nitrite, the RO permeate was then sent through an ion-exchange column. The effluent from the ion exchange went on to an ozone column that acted as the final disinfection barrier. On-line TOC analysis was performed at the RO effluent point, designated NC9, and its corresponding influent. Both the influent and effluent of the RO membrane system were monitored over a 14 day period.
Results and Discussion
During the monitoring period, average TOC values for the influent was approximately 6000 ppb. TOC values for the effluent ranged from 150 ppb to 20 ppb with an average TOC value of approximately 50 ppb. On-line TOC analysis demonstrated the ability to detect more than a 2 log removal of TOC between the influent and effluent streams. The data revealed a positive correlation between the influent and effluent stream TOC values. As the influent TOC values decrease, the effluent TOC values decrease, and as the influent TOC values increase, the effluent TOC values increase.
On-line particle counting typically shows a one to two log removal of particles depending on particle size and concentration in the RO streams. On-line conductivity measurements typically show no more than a two log change between RO influent and effluent. A three to six log pathogen removal as shown by standard plate counts can be achieved depending on the type of RO membrane used and manufacturer. Of the three on-line methods, TOC monitoring appears to correspond the closest to the log removal of pathogens. However, one or more of these methods may be necessary to ensure reliable operation of an RO system.
Conclusions
Re-use of wastewater is now recognized as an ecological and economic necessity due to decreasing ground water tables, land subsidence, saltwater intrusion and chemical pollution. Reverse osmosis is being used successfully to purify wastewater. However, proper analytical methods must be used to ensure continued water quality.
This study shows that on-line TOC analysis is potentially more sensitive than other membrane performance tests. Since pathogens are carbon-based species, any substantial breakthrough in TOC could be indicative of a system upset. Pathogens can break through without any changes to the water's conductivity, a commonly measured parameter. On-line TOC analysis offers real time quantifiable results and should be used as the first indicator of RO system upsets before more serious problems occur.
About the Author:
Karen A. Clark is a product manager at Anatel Corporation. She has over 15 years experience in a variety of industries focusing on analytical instrumentation including methods development and validation. Ms. Clark has been a guest presenter at a number of professional conferences including AWWA's Water Quality Technical Conference, The Pittsburgh Conference, and The International Water Conference. She is a member of the American Chemical Society, the International Society of Pharmaceutical Engineers and AWWA.

