Optimizing Efficiency When Pumps are Operated as Both Pumps and Power Recovery Turbines

By Allan R. Budris
I continue to receive many questions and much interest on the topic of operating pumps in reverse as turbines (PAT), since my August 2009 and November 2009 columns. A fair amount of this interest has been related to applications where the pump is operated as both a pump and turbine in the same system (at different times). In most of these cases the objective is to pump and retrieve water between two reservoirs at different elevations as a means of energy storage and retrieval, to take advantage of lower energy rates at off peak periods, or to level out uneven energy generation.
In order to optimize the overall system efficiency for such an application, the different best efficiency (bep) flow points for pump and turbine operation, plus the different shapes of the pump and PAT head-capacity and efficiency performance curves should be taken into consideration. The primary question for such operation then becomes: "What pump selection will allow the pump to operate in the desired system so as to achieve a flow rate that will yield the optimum overall system efficiency (pump plus PAT)?"

Such a pump selection is complicated by the fact that the bep head and flow rate for a PAT is greater (by roughly the inverse of the pump bep efficiency) than the corresponding bep head and flow rate as a pump, as detailed in the writer's August 2009 column. In order to properly analyze this situation, the following factors must be considered and evaluated:
- Determine the system Head-Capacity curve for pump operation. This includes the "static" (zero flow, elevation) head, plus the "friction" (velocity) head which increases as the square of the flow rate.
- Make the initial pump selection and obtain the constant speed pump Head-Capacity curve. The maximum impeller diameter should typically be selected when the pump will also be used for PAT operation.
- Plot the constant speed pump Head-Capacity curve against the system pump H-Q curve. The pump will operate at the intersection between the pump and pump system H-Q curves.
- Determine the system Head-Capacity curve for turbine operation. This includes the "static" head, minus the "friction" head.
- Establish the constant speed Head-Capacity curve for the pump operated in reverse as a turbine. The PAT bep can be approximated by dividing the pump bep head and capacities by the pump bep efficiency, with the curve shape being obtained from the dimensionless PAT H-Q curve included in the writer's August 2009 column. The pump manufacturer should be contacted for a more accurate / actual PAT curve.
- Plot the constant speed turbine (PAT) head-capacity curve against the system turbine H-Q curve. The PAT will operate at the intersection between the PAT and system H-Q curves.
- Obtain the constant speed pump efficiency vs. flow rate curve from the pump manufacturer.
- Acquire the pump efficiency for the above pump operating flow point.
- Establish the PAT efficiency vs. flow rate curve. This can be approximated using the dimensionless plot presented in the writer's August 2009 column, and assuming that the PAT bep efficiency is equal to the pump bep efficiency. It should be noted that, for VTP PAT operation, the bep efficiency is normally about two points less than the pump bep efficiency, due to the bowl vane angle mis-match with the impeller vanes, in reverse flow operation. Again, the pump manufacturer should be able to provide a more accurate PAT efficiency vs. flow rate curve. In all cases, at constant speed, the PAT efficiency will go to zero well before the zero flow point.
- Acquire the PAT efficiency at the above turbine operating flow point.
- Based on these two efficiency values (pump and PAT), determine the overall system energy storage and retrieval efficiency.
- Repeat the above process for other pumps to obtain the highest overall system efficiency.
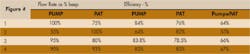
As an example, the writer has performed the above process for a 3 stage, 18 inch Vertical Turbine Pump (VTP) on several systems to determine the pump (flow) selection that would give the best overall system efficiency. It should be noted that the author chose to vary the static system pressure instead of the pump selection to simplify the process. The sample operating conditions (bep flow rates) evaluated were:

The final step in this exercise is to apply the above acquired flow rates, for the four sample conditions, to the respective pump and PAT efficiency curves for the 18" VTP pump, as plotted in figure 5. The resulting efficiency values for these above conditions are summarized in Table 1.
As can be seen in Table 1, the best overall (pumpxPAT) efficiencies were obtained when the pump was selected to operate a little to the left of the pump bep flow rate (between 90% to 95% of bep), with the optimum condition being dependent on the actual shape of the pump, PAT and system H-Q and efficiency curves.
CONCLUSIONS:
The take away from the above exercise should be the importance of determining and comparing both the pump and PAT unit and system head-capacity and efficiency curves, then determining the operating points and efficiencies for both pump and turbine operation, in order to optimize the overall system efficiency.
Finally, many readers have wanted to know which pump companies offer pumps to operate as turbines (PAT's). The writer is aware that KSB, Flowserve and ITT Goulds all offer pumps to also operate as turbines. WW
About the Author: Allan R. Budris, P.E., is an independent consulting engineer who specializes in training, failure analysis, troubleshooting, reliability, efficiency audits and litigation support on pumps and pumping systems. With offices in Washington, NJ, he can be contacted via e-mail at [email protected].More WaterWorld Current Issue Articles
More WaterWorld Archives Issue Articles