By Jacques Brados and Gary Wong
The term “analytics” is a new buzzword in the water industry. Many industry analysts predict that analytics will transform operational decision-making at water and wastewater utilities over the next 5 to 10 years. In the here and now, industry trends are driving improved asset management. Aging infrastructure and an aging workforce, limited capital to fund new equipment, and efficiency demands place escalating pressure on the water industry to optimize decision-making to improve performance, reduce costs, and minimize risk. Smart integrated infrastructure is changing the management of assets, which translates to smarter operations.
For example, utilities that combine OSIsoft’s PI System, a real-time data infrastructure, with Black & Veatch’s ASSET360™ analytics platform can use the power of data to determine the operational status of a water pump - from its speed and efficiency, to its bearing temperature, vibration level, and other parameters. The availability of detailed data allows analytics tools to evolve toward enterprise operations, include forward-looking predictive solutions, and emphasize business values.
Despite the urgency of smarter operations, water utilities are still unclear about analytics-based decision-making. This article presents three utilities that used analytics to address issues or improve operational efficiencies. These examples demonstrate the value of data analytics and demystify the process of incorporating real-time analytics into utility operations.
Utility One: A High-Turbidity Mystery
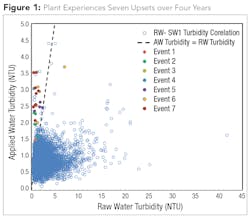
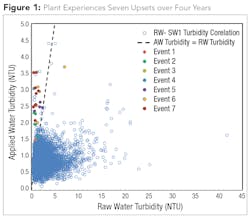
The plant experienced seven high-turbidity events in four years, which adversely affected operations. Each event required additional operators to backwash filters until the condition passed. Plant operators could not correlate the events to flow rate, time of day, time of year, or other obvious conditions. To isolate and prevent future occurrences of the problem, Black & Veatch engineers analyzed historical water quality data from the SCADA system, labs and other sources archived in the data infrastructure. They observed water turbidity at different stages of the filtration process.
Figure 1 compares raw water turbidity to applied water turbidity. Operators injected chemicals into raw water entering the plant, which routes water through a sedimentation process before filtration. Operators measured water turbidity at three points in the process: raw water upon plant entry, after chemical addition, and before filtration at the end of the sedimentation process.
The figure illustrates 7 years of data. Colored dots represent turbidity events. Black & Veatch analysts noted two important observations: 1) high-turbidity events occurred only when the turbidity of the applied water exceeded 1.5 NTU; 2) these events occurred only when the turbidity of the applied water was higher than the turbidity of the raw water. Under these conditions, the water exiting the sedimentation process to the filters was dirtier than the water entering the treatment plant.
Based on these observations and using the analytic tools in ASSET360, engineers developed a simple solution to a complex problem. Today, operators and management at all levels of the plant have access to a user-friendly dashboard that tracks the turbidity of raw versus applied water. The dashboard issues alerts to notify plant operators when the turbidity level of applied water exceeds 1.5 NTU, and when the turbidity of the applied water exiting sedimentation exceeds 1.5 NTU and is higher than the NTU of the raw water entering the plant. The dashboard prompts operators to add additional chemicals whenever raw water turbidity approaches 1.5 NTU. This data-centered solution has prevented further turbidity incidents.
Utility Two: Driving Down Energy Costs
A water utility pursued the most efficient way to supply water to a district metered area. The area’s 4,000 residents receive water from a reservoir with a pump station and a well site. The water utility asked Black & Veatch to find the most energy-efficient method of supplying water via their two water sources.
Engineers observed flow rates exiting the SCADA system and reviewed the electric bill rate and the efficiency curves from the pump’s design documents. They noted that during a one-month period, the well site cost approximately $53 per million gallons, and the pump station on the reservoir cost approximately $54 per million gallons. At first glance, the water sources appeared to have similar costs. Engineers decided to review the cost of a million gallons of water per energy expired. The well site used 31,000 MW/hr while the pump station consumed 23,000 MW/hr. The energy expenditures indicated that the well site generated 1.1 million gallons per MW while the pump station generated 1.4 million gallons per MW. The pump station was significantly more energy efficient than the well site, however, that advantage was not reflected in the cost.
Upon further investigation, the engineers discovered that the well site operated on a highly advantageous seasonal billing rate while the pump station billing accrued at a time-of-use rate. In this case, simply changing the rate structure for the pump station created an immediate savings. The utility reduced the electrical cost of the pumping station by 21 percent, and by doing so, reduced the overall district costs by 10 percent.
The engineers found that electrical efficiency varied for different flow rates. The pump station was more electrically efficient because it uses five pumps - two small, two mid-sized, and one large. The two smaller pumps were significantly more electrically efficient than the well site, which uses a single large pump. However, at higher flow rates, the well site was more electrically efficient than the multiple pumps in the pump station when delivering water at similar rates. The utility had to consider electrical efficiencies at different flow rates when determining the optimal method of sourcing its water (see Fig. 2).
Engineers wanted to evaluate the total water cost to deliver to the reservoir versus the total cost of pumping water from the well. The well site proved to be less expensive; however, as good water stewards, the utility did not want to lower the water table. As a result, their current goal is to ensure that they replenish used water. Black & Veatch is working with the utility to achieve this goal and expects to establish a plan in 2016.
Utility Three: Predicting Asset Failure
Operators of a drinking water station with three 250 HP pumps noted an unusual trend: over time, they needed to run all three pumps more often to meet flow requirements. Engineers collected data on pump speed, flow rate, pressure, and supply reservoir level from the SCADA system, and pump curve and system curve data from the station’s design documents.
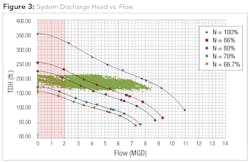
As Figure 3 illustrates, the engineers collected about seven years of plot data. In this graph, the top wavy line represents 100 percent pump speed, and the bottom wavy line represents 67 percent pump speed; the engineers had excellent visibility into everything between 70 and 100 percent pump speed.
At first glance, the plot looked normal. When engineers placed the design curves on top of the SCADA data, however, they realized there was a minimum 2,000 gal/hr recommended flow rate for each pump. The pumps spent a significant amount of time at the lower flow rates. The engineers pondered the effect of operating pumps at 70 percent or better speed at low flow rates. The answer was recirculation cavitation.
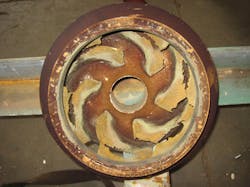
When the engineers pulled the pump impellers, they found one impeller destroyed and the others with significant damage. Moreover, when the engineers reviewed the raw data, they noticed that the pump station’s kWh/million gallon rate steadily increased over time, which is generally an excellent indicator of impeller wear (see Fig. 4).
To help utility operators avoid this problem in the future, engineers created a dashboard and notification system that helps the operators predict impeller wear. Now when the kWh/million gallon rate rises 5 percent higher than pump design specifications, the operators receive a warning. When the increase exceeds a 10 percent rise, the notification system issues another warning to operators and prompts them to begin impeller inspection. Black & Veatch can now calculate impeller wear by dividing mechanical energy by electrical energy. That, in turn, allows the plant operators to plan ahead and schedule the optimal rebuild time into CIP planning.
The operators estimate they spent over $100K spinning a pump without impellers. The new warning system will help operators avoid this problem in the future and reduce electrical costs. Black & Veatch engineers benefitted from an important problem-solving lesson: Some of the critical data, particularly the pump design limits and electrical energy used, were not captured by the SCADA system. Engineers used affinity laws and “power is proportional to speed cubed” to solve this problem.
Conclusion
These three utility examples demonstrate the value of employing data analytics to protect critical resources, increase operational efficiency, and pilot cost-effective asset management. As utilities grapple with aging infrastructure, limited investment capital, and escalating consumer demand to lower costs, they will need to find new ways to balance and optimize asset performance, cost and risk. A new generation of analytic tools and the development of smart integrated infrastructure offer plant operators a new opportunity to meet those needs and more easily transform their raw process data into actionable intelligence.
About the Authors: Jacques Brados, Regional I&C Manager, Black & Veatch, has over 20 years of technical and managerial experience providing SCADA and Instrumentation & Control management in water, pharmaceutical, manufacturing, and nuclear energy. Gary Wong, Principal, Global Water Industry, OSIsoft, brings a wealth of international experience in providing sustainable, strategic and cost-effective business solutions to the water and wastewater industry. Prior to OSIsoft, Gary was the Corporate Applications Manager at Metro Vancouver.
More WaterWorld Current Issue Articles
More WaterWorld Archives Issue Articles
