By David Rubin
Most utilities understand that fixed-network advanced metering infrastructure (AMI) systems eliminate estimated meter reads and improve billing accuracy. Yet, billing is only one way that AMI benefits utilities.
Today, utilities are looking to the millions of data points in their AMI databases for actionable intelligence to improve customer service and strengthen the bottom line. In addition, utilities are turning AMI systems into smart infrastructure systems that incorporate sensing and communications solutions to detect problems throughout their distribution networks.
Improving Customer Satisfaction
Good customer relationships build confidence in the utility, making it easier to get public support for infrastructure and water services projects. According to J.D. Power’s inaugural water study in 2016, “overall satisfaction in a water utility is higher when a customer recalls a communication in the last six months from their water utility than when they don’t recall a communication.”
Proactive communication with customers to inform them of potential leaks on their properties is one way to build customer satisfaction. Many utilities have introduced such programs, based on analysis of customer water use, including the New York City Department of Environmental Protection (NYCDEP), which notifies customers by email when it detects unusual spikes in water usage. The utility will then forgive up to a half of the high bill after the leak is fixed.
While NYCDEP is a large utility with an automated system of notifying customers, smaller utilities can use reports run from their AMI system to identify customers with leaks, in some cases even letting the customer know what type of leak it is.
Bend, Ore., a city of approximately 80,000 located on the eastern edge of the Cascade mountain range, is an example of a small city that uses AMI data to build customer relationships and promote conservation. Conservation is a priority for the City of Bend, as it is for many cities in western states, and its ongoing programs are designed to reduce wasteful watering by homeowners, landscapers and contractors.
As part of the conservation effort, as well as to save customers money, the city proactively reaches out to homeowners suspected of having leaks on their properties. What is unique about the program is that the city not only notifies customers of potential leaks but lets them know what type of leak it is.
City employees evaluate the patterns seen in usage data to determine the type of leak that may be increasing customer water bills and thwarting conservation efforts.
For customers in Bend, most leaks are found in toilets and along service lines. In Bend, 99 percent of leaks occur in toilet fill valves, with an occasional flapper valve problem or a leak along the service line. The city identifies the leak type by evaluating constant consumption reports that are available through its advanced metering system, in this case the Aclara STAR Network AMI system.
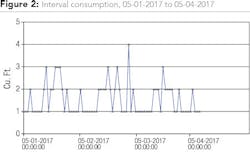
“If you get one or two cubic feet per hour of constant consumption, it’s the fill-valve leak,” said Spencer Cashwell, program technician for the City of Bend. “Rather than coming up and stopping, the valve comes up but water still trickles around it and goes down the overflow. Nothing is heard or seen.”
Cashwell added that some leaks fluctuate between one and 10 cubic feet per hour, which usually indicates a flapper valve not securely closing as the tank fills. “This type of leak means that the flapper valve is hanging up. The leak is pretty constant, but the flow fluctuates.”
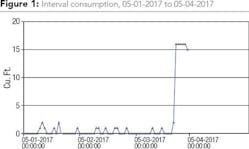
Service-line leaks are also an occasional problem in Bend because polyvinyl chloride (PVC) connections go bad at connections to homes or meters, which in Bend are located outside homes in meter pits. These substantial leaks, often six cubic feet per hour or more, might go unnoticed by the homeowner until the water bill comes, in part because leaks dissipate underground through rocks rather than coming to the surface.
“If you see a burst leak or one that starts ramping uphill, it’s on the service line outside, either at the shutoff valve or where meters connect to the service line,” said Cashwell.
Until recently, Cashwell would run a report each month, identifying possible leaks and contacting homeowners. But the process was time-consuming and some homeowners would not be notified until a month or more after the leak started. Bend recently started using software to analyze consumption patterns, allowing Cashwell to do a similar review daily rather than monthly.
Drilling Deep with Analytics
In addition to identifying leaks for customers, analytics can help solve other problems for water utilities. One of the thorniest is identifying and reducing apparent water losses that occur because of meter tampering, billing errors, and failing or improperly sized meters. Apparent losses are particularly tough for utilities to identify because they are not physical water losses but rather water that is metered but unbilled, which means these losses directly affect revenue collection and the bottom line.
One of Aclara’s partners, Valor Water Analytics, has developed a set of water-specific algorithms that can help utilities recover between one and five percent of top line revenue that is now being lost in their systems through apparent losses. For a $100 million utility, that amounts to one to five million dollars a year.
These algorithms are especially useful in identifying dying or decaying meters, which normally cannot be found without pulling meters out of the ground and testing them. In fact, most utilities do not look for failing meters. They change them out during routine meter replacement programs, which are expensive for the utility because many good meters are replaced along with the bad.
To identify failing meters, the apparent water loss detection software analyzes historic AMI data and then ongoing hourly water-use data. This establishes a baseline for each meter, after which irregularities from the pattern are identified through proprietary algorithms and ongoing analyses.
Meters that show a pattern of decline can be replaced individually. This more surgical approach to pinpoint bad or incorrectly sized meters can help utilities reduce apparent losses and find hidden revenue.
Reducing Real Water Losses
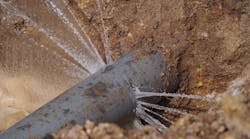
Real water losses on the distribution system are caused by leaks on water mains and at device connections or by tank overflows. These losses are costly for the utility because, like apparent losses, they are not metered. In addition, finding these leaks can help utilities conserve water and meet regulatory requirements.
Technology to find water losses varies but collecting data from sensors or monitoring points located throughout the distribution system improves the efficacy of AMI solutions. For example, acoustic leak detection can operate on AMI networks, listening for the noise created by leaks in pipes and sending data from devices on water mains back to utilities where it is correlated to identify leak locations.
The Aclara STAR® ZoneScan solution, as an example, combines acoustic data loggers from Gutermann International with Aclara’s STAR network technology to provide fully integrated leak detection through the fixed-network AMI system.
The loggers gather time-synchronized sound recordings that are sent back to the utility over the fixed-network infrastructure. Web-based application software correlates the data between loggers and provides visual identification of high-probability leak locations. Similarly, other types of sensors monitor other trouble spots on the distribution network such as changes in pressure or tank overflows.
Moving Forward
By adding analytics and finding additional ways to employ their AMI networks, water utilities are building a far more advanced and encompassing smart infrastructure solution (SIS) for managing their water distribution systems.
The versatility of this SIS approach provides greater network visibility, manageability and actionable information for utilities and their customers. By integrating a range of hardware, software and data technologies, SIS helps water utilities reclaim lost revenue and mitigate the impact of theft, unmetered consumption, meter inaccuracy and leakage.
About the Author: David Rubin is a product manager with Aclara, provider of smart infrastructure solutions (SIS), metering, monitoring, communications and customer engagement solutions to water, gas and electric utilities.
