By David A. Wiley
“Simplicity is the ultimate sophistication,” said Renaissance scientist and engineer Leonardo da Vinci. Five hundred years later, it remains a sound maxim for a water utility that is seeking to develop an effective drought contingency plan — one that is based on sound science and methodology, yet is easy to understand, apply, and update.
In 2009, the City of Sarasota, Florida Water, Sewer, and Reclaimed Water Division implemented a simple, yet effective drought contingency plan (DCP), becoming the first city in the Southwest Florida Water Management District (SWFWMD) to develop a formal plan. Based on an analysis of 20 years of rainfall data and an evaluation of annual minimum groundwater elevations or water quality in two monitoring wells, engineers defined four specific drought levels, associated triggers, and demand-management action plans. As a result, the City has a systematic plan to manage its groundwater resources during periods of low rainfall.
The City of Sarasota is located on the Gulf Coast between Tampa and Fort Myers. The City supplies approximately 7 million gallons per day (MGD) of treated drinking water to residential and commercial customers from three well fields. Two well fields are full-time facilities: the Verna Well Field, containing 39 production wells, is located approximately 20 miles inland; and the Downtown Reverse Osmosis (RO) Well Field, containing eight supply wells, is located on the Gulf Coast. The third, containing four supply wells, is used only during emergency events. Normally, raw water from the Verna Well Field is aerated, treated through the ion-exchange process, and blended with water from the City’s Downtown RO Well Field at the Downtown RO treatment plant. Each well-field operation is permitted by the SWFWMD.
The Sarasota area normally receives approximately 54 inches of rainfall a year, two thirds of that total from June through September. In the past, the City responded to rainfall deficient periods by shifting operations to the most productive wells. However, due to the hydrogeology of the aquifer, a prolonged dry period results in significant aquifer water-level declines.
The City engaged Leggette, Brashears & Graham (LBG) to develop a plan that would enable the City to identify trends in rainfall and groundwater levels allowing appropriate management of the City’s well fields and the groundwater resources. The new plan identifies four levels of water-supply shortages and triggers with associated demand-management actions. The plan is modeled after the approach used by SWFWMD in its water shortage plan. It uses hydrologic triggers that were identified through a statistical analysis to create a systematic response to increasing drought conditions. Although the plan was designed for water-supply conditions during spring, when groundwater levels are approaching annual lows, the City can use it whenever necessary based on the prevailing hydrologic conditions.
Twenty Years of Rainfall Data
Rainfall-deficit, water-quality, and below-normal groundwater level triggers were identified based on an analysis of existing historical rainfall, groundwater levels, and groundwater quality data, which were collected by the City and U.S. Geological Survey from January 1977 through September 2008 in the vicinity of the Verna Well Field and the Downtown RO Well Field.
A standard electronic spreadsheet program was used to develop a 12-month moving rainfall summary (MRS) to identify drought conditions based on rainfall data collected at the Verna Well Field for the period. Average annual rainfall data were used to calculate the historical annual average and the 25th, 20th, 10th and 5th percentiles (%) for the entire record.
These data were used to plot a simple line graph, which clearly displays the rainfall trend over the period of record and highlights key rainfall levels: average annual rainfall for the water year period of record (50.5 in.); 25th, 20th, 10th and 5th percentiles (%) of the 12-month MRS for the entire record; and two drought levels, Drought Level I (Drought Alert) at 25% and Drought Level II (Water Shortage) at 10%. (see Fig. 1).
Groundwater Elevation and Water Quality
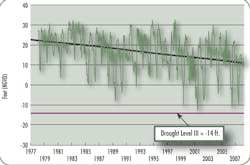
Triggers for Drought Level III (Water Supply Warning) were developed from an evaluation of the annual minimum groundwater elevations and associated trends in monitoring well “T-01,” which is located near the City’s Verna Well Field (see Fig. 2). Monitoring well T-01 has a 30-year record and is located outside the direct area of well-field production influence. A value of -14 feet National Geodetic Vertical Datum (NGVD), or elevation with reference to mean sea level, was selected as the Drought Level III (Water Supply Warning) trigger based on a return period of the 50-year event.
One additional trigger, which applies to the City’s Downtown RO Well Field, is based on groundwater quality at an associated monitoring well, where the City has monitored chloride concentrations since 1994. If a significant, continual increasing trend in chloride concentrations occurs at this well, averaging above 35 milligrams per liter (mg/L), it triggers Drought Level III.
Finally, evaluation of operational constraints at production wells was used to identify the trigger for Drought Level IV (Water Supply Crisis), which occurs when groundwater can no longer be pumped from a production well; that is, when the water level is within one foot of the pump setting.
Figure 1: A 12-month MRS for January 1977 through September 2008, the end of the water year. The graph shows the average annual rainfall for the water year period of record; the 25th, 20th, 10th and 5th percentiles (%) of the MRS; and Drought Levels I and II.
The City initiates appropriate demand-management actions for each drought level. Drought Level I requires lawn-watering restrictions. Under Drought Levels II and III, the City initiates additional actions, including increased enforcement, additional water-level measurements in production wells, adjusted well-field operations, and modification of well-pumping equipment. Finally, under Drought Level IV, the City requires elimination of all non-essential outdoor water use.
Figure 2: Historical water-level data for monitoring well T-01 and Drought Level III (Water Supply Warning), which is triggered by a value of -14 feet National Geodetic Vertical Datum (NGVD), or elevation with reference to mean sea level based on a return period of the 50-year event.
Along with the DCP and accompanying written report, LBG provided the supporting spreadsheets and base graphs to the City and trained the staff of the Water, Sewer and Reclaimed Water Division to periodically input new data and update the tables and graphs. The plan is also designed to allow triggers and actions to be adjusted or modified as needed due to changes made to City water supply operations and the collection of additional hydrologic data.
Sophisticated in its simplicity, this proactive plan provides the City of Sarasota with the tool it needs to meet its water supply obligations in times of water supply shortages due to hydrologic drought conditions.
About the Author:
David A. Wiley, P.G., is a Sr. Vice President of Leggette, Brashears & Graham, Inc., professional groundwater and environmental engineers, in their Tampa, Florida, office. Wiley has more than 29 years of experience on water resource related issues. Supporting information for this article was supplied by William Hallisey, Director of the Water, Sewer and Reclaimed Water Division of the City of Sarasota Department of Public Works, and Javier Vargas, the division’s General Manager - Plants and Environmental.


