Increasing tariffs and introducing advanced metering infrastructure continues to be a politically sensitive topic but certain states in the U.S. are overcoming this challenge. The City of Atlanta is set to increase its annual water bill by 206% by 2012. Greg Baird looks at what can be learned from the continent's approach.
Water tariff discussions are normally heated debates, regardless of language or geographic location. Some may claim that water should be free; however, the costs associated with water services are real costs which need to be passed onto the water users.
The U.S. receives enough annual precipitation to cover the entire country in a depth of 30 inches. These 30 inches is known as the U.S. water budget. The eastern half of the country receives more rainfall than the western half. While the west has 28% of the U.S. population, the arid west accounts for 80% of the average water consumed, mostly due to irrigation practices. The water supply, storage, treatment and distribution are asset intensive functions. Let's not forget these assets are very capital intensive. The ratio of assets to revenue represents the net dollar amount of assets needed to generate one dollar of revenues. For example. a U.S. municipal water utility is $7.03 as compared with an electric utility at $1.61 and telecommunications at $1.11. This means that a $7.03 capital investment in water infrastructure is needed to generate $1.00 in revenue.
Community acceptance of water tariffs is rarely given freely, but after long debates and with in-depth reviews of costs. There are several lessons that have been learned as a result in the U.S., and could offer guidance internationally.
Credit: Badger Meter
The Pacific Institute says that residential water use efficiency measures can save enough water to meet the needs of five million people by 2020.
Lesson #1 Always charge something for water; never give it away for free.
Eventually, the public accepts the fact that a price should be paid to avoid having to carry their own water buckets from a raw water source to meet their water related needs. At this point a rate can be established, but the intensity of the debate increases as the requested rate increase goes up or the frequency of requests seems ongoing.
Lesson #2 Complete a cost of service/rate study and review the issues of fairness and equity
Around 85% of U.S. water utilities are owned or controlled by local municipalities. The utilities were established as enterprise funds (separate from the general fund paying for police and fire services) which maintained a separate set of accounts with a revenue source derived from the sale of water. Sales tax and property taxes were used for other city services. When the high costs of growth and expansion started to force up water rates, laws were passed to allow developers to pay to offset the capital expansion costs.
Credit: Badger Meter
These fees and charges are called connection fees or tap fees, which pay for the new infrastructure costs only. The operations and maintenance costs still remained as the burden of those who are using the water services. Replacement of all used facilities is also a cost of the existing user. Such a diversification of revenue helped spread the financial burden and helped the general acceptance of water rates because customers were told they were paying their fair share. The "fair share" concept in turn solidified the concept of ownership and responsibility. The establishment of a fair share concept is a critical step in communities understanding and accepting any water rate increase.
As a result, if a government circumvents or over subsidises, the underlying feeling of responsibility will never take hold and the belief in fairness is diluted to the point where consumers lack trust toward those in charge. Each customer class; residential, commercial, industrial, irrigation drives the costs differently for a utility. These costs should be studied and allocated correctly to form the basis of the fair and equitable water tariff. Re-calculating the value of water or cost of water services and reallocating costs by user group can be a difficult process. This should be a participatory and transparent activity in order to be accepted by the public.
Lesson #3 Communicate costs with the rate payers on an ongoing basis, regulations will change
At the beginning of the first half of the 20th century water supply and sanitation were a local government responsibility with regulation at the state level. The U.S. federal government played almost no role in the water sector at that time. This changed with the enactment of the Federal Water Pollution Control Act of 1948, which provided for comprehensive planning, technical services, research, and financial assistance by the federal government to state and local governments for sanitary infrastructure. The federal role increased from that point on, enacting regulations and costs.
- In 1948, the Federal Water Pollution Control Act was passed
- In 1965, the Act was amended, establishing a uniform set of water quality standards and creating a Federal Water Pollution Control Administration authorized to set standards where states failed to do so. Comprehensive federal regulations for water supply and sanitation were introduced in the 1970s, in reaction to an increase in environmental concerns
- In 1970, the US Environmental Protection Agency (USEPA) was created
- In 1972, the Clean Water Act was passed, requiring industrial plants to proactively improve their waste procedures in order to limit the effect of contaminants on freshwater sources
- In 1974, the Safe Drinking Water Act was adopted for the regulation of public water systems.
This law specified a number of contaminants that must be closely monitored and reported to residents should they exceed the maximum contaminant levels allowed. Drinking water systems were closely monitored by federal, state, and municipal governments for safety and compliance with existing regulations. During the 1970s huge federal government grants were offered which built a great deal of the wastewater capacity for cities, which would last the next 20 years until more regulations and growth would require additional capital investments. The 21st century is experiencing the replacement costs of this infrastructure without the benefit of significant federal subsidies. The replacement costs and weak water sales due to the economy are currently putting a great deal of pressure on utilities to increase rates.
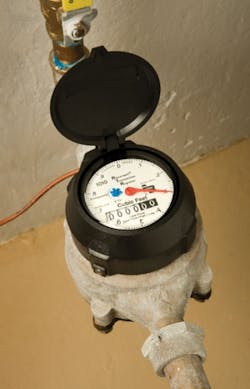
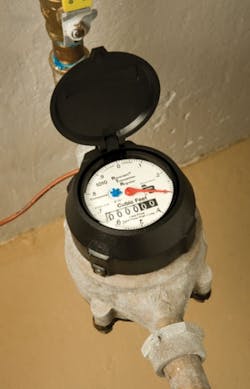
Lesson #4 Water meters are a prerequisite for accurate, volumetric water billing
The U.S. Geological Survey states that over six billion gallons of water per day is lost to water distribution system leaks and other unaccounted for uses, an amount sufficient to supply the ten largest U.S. cities. According to the Pacific Institute, residential water use efficiency measures can save enough water to meet the needs of five million people by 2020. Irrigation efficiency practices, too, can save enough water to supply 3.6 million people per year.
More and more cities and utilities are recognising the need for accurate demand management and working to find better water management solutions. Cities like Boston and Seattle are making significant strides in accurately calculating and controlling demand by incorporating conservation and efficiency measures into demand calculations and water supply plans.
After a long drought and significant increase in water consumption, the Massachusetts Water Resource Authority (MWRA) in Boston was created in 1985 to reduce per capita demand by 10% in three years. The MWRA identified inefficiencies in the city's infrastructure, formed a highly detailed audit system, assessed cultural and behavioral issues from domestic, commercial, and industrial water users, and addressed pricing issues. Twenty years after the program began, the MWRA dramatically reduced water demand to 205 million gallons per day, far below the original projection of 450 million gallons per day. By committing to water efficiency, Boston was able to grow its customer base by two million people, reduce its water consumption by one-third – to 1911 levels- and save $500 million by eliminating the need to build a dam.
In Seattle where it rains a great deal, a reliable water supply that satisfies demand in the face of rapid population growth and climate changes is a significant concern. In 1992, a drought led to mandatory water use restrictions and tiered pricing for consumers. In 2000, Seattle's water supplier implemented a Regional 1% Water Conservation Program that sought to reduce water consumption by 1% every year for ten years. The water conservation measures used in Seattle's water supply planning have reduced water consumption by 24% since 1990, even though the population increased by 11%.
Lesson #5 Rate setting is a continuous process, not a one-time deal
Water consumption in the U.S is more than double that in Central Europe, with large variations among States. Overall, water use in the U.S is increasing every year and many regions are starting to feel the pressure. At least 36 states are anticipating local, regional, or statewide water shortages by 2013, even under non-drought conditions.
In the U.S. nearly 800 cities have wastewater systems were that were originally combined with many storm runoff networks and have only been designed on the basis of the historic hydrologic record, taking not taking into account of possible changes in flow conditions due to climate change. A 2004 USEPA report to the U.S. Congress estimated that there are 9,348 combined sewer overflows in the U.S., discharging about 850 billion gallons of untreated wastewater and storm water to the environment. It is estimated that between 23,000 and 75,000 sanitary sewer overflows occur each year, resulting in releases of between three and 10 billion gallons of untreated wastewater.
Lesson #6 Any rate increase is better than no rate increase at all
Sometimes utility managers are forced to accept minimum rate increases. The lowest level should be at least enough to recover operating and maintenance expenses. This level should also attempt to increase the amount of communication between the utility and the public to build rapport and increase trust, which can create the path to future rate increases. Customers like to feel like there is a tangible benefit back to them like better customer service or more payment option.
The next level of charges would include some portion of the capital charges. Accepting even an inflation based rate increase can be helpful even though the small increase will not reduce any existing infrastructure funding gaps. A recent Black & Veatch 2010 survey indicates the average U.S. annual increase in typical residential water bills is approximately 5.3% from 2001 through 2009, while the increase in typical residential sewer bills is approximately 5.5%. During this same time period the consumer price index increased by 2.4%.
Lesson #7 Comparing rates can be difficult - local circumstances will always make the rates different
The mean U.S. water tariff excluding sewer tariffs - was $2.72 per 1,000 gallons ($0.72 per cubic meter) in 2000 with significant variations between localities. Average residential water tariffs for a monthly consumption of 15 cubic meters varied between $0.35 per cubic meter in Chicago and $3.01 in Atlanta in 2007. Annual combined water and sewer bills vary between $228 in Chicago and $1,476 in Atlanta in 2008. For purposes of comparison, the average water and sewer bill in England and Wales in 2008 was equivalent to $466.
Credit: Badger Meter
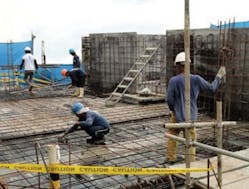
Collecting data: highly detailed audit systems are required to identify inefficiencies in the any city's infrastructure
Lesson #8 Water demand management helps reduce future supply costs
Within the arena of water resource planning the critical data of the demand forecast and demand management is required first in order to evaluate the need for new supply development. Public water supply systems cannot be made entirely "drought-proof" through supply development and augmentation. There are limits to such traditional supply-side approaches, including increasing costs of supply development, concern over environmental impacts, and in many cases, political controversy. As a result, water demand must be managed just as supplies must be managed.
Demand-side management is a powerful tool which can reduce future water needs, and if the effort is sustainable, then it can be treated as an additional source of water supply. It has a cost, a yield, and environmental considerations and needs to be closely evaluated just as a new supply project would.
Due to the importance of demand management and the need to shift from voluntary conservationism to operational control, technology will continue to be developed and implemented. With GIS as the backbone, the demand management tools will include advanced metering infrastructure (AMI) like smart meters, sensors, advanced control devices and improved communication equipment. Smart meters do not increase the volume or security of water available to customers. However, they can empower customers with the information to manage their own consumption better than they can today, and may facilitate an environment where mandatory restrictions are replaced with a combination of price signals and voluntary water efficiency measures.
Lesson #9 Conservation means less water sales, reducing revenues
Utility revenue in the U.S. was fairly stable when the water accounts were unmetered and uniform rates were applied to all customers. Billing systems were not technologically advanced and therefore rate designs were very simple. Revenues were predictable with the change of customer accounts as the main variable. Water was cheap and plentiful and everyone seemed happy. The pendulum then started to move the other direction through the forces of water scarcity, the introduction of water meters, and the public education on the true cost of water, conservation programs and new rate designs.
Reliance on 100% fixed rates revenue has shifted to only a small percentage of total water sales revenue (less than 20%). Revenue recovery, as a result, became more unstable, being subject to any factor that could influence the change of water demand. These factors included weather, voluntary or mandatory water restrictions, and public education and changing water use behaviors, the introduction of water saving devices, and the consequences of price signals that caused customers to reduce their water use to maintain a consistent household water budget (price elasticity of demand), and inevitably a down turn in the local and national economy.
By reducing or delaying improvements and maintenance, however, costs may actually increase in the future –pay now or pay even more later. Another option is operating the utility in a more financially weakened condition, but this could create a downgrade in credit and increase the cost of future borrowing. Other political, legal and economic forces also exist. For example: most approving authorities will not allow the utility to increase rates to make up for a loss of revenue from conservation.
Lesson #10 Affordability is always at the heart of water rate increases
A 2010 survey showed that 95% of American voters value water over any other service they receive. In fact, the nationwide survey showed that 63% of Americans are willing to pay a little more. The median household spent about 1.1% of its income on water and sewerage. However, poor households even in 1997 (18% of U.S. households) paid more than 4% of their income on their water and sewer bill. In 2002, the average American family spent $474 on water and sewerage charges which is about the same level as in Europe. The City of Atlanta is in the middle of a $4.1 billion project to overhaul its system. Rate increases already approved will make the average water bill jump to $151.92 from $49.60 per month; a 206% increase by 2012. In 2008 an annual water bill is $1,476 in Atlanta putting them at or near the top nationally for water bills.
A decline in U.S. personal household income, combined with a prolonged downturn in the overall U.S. economy has raised the issues of utility rates and customer affordability. The question U.S. policy makers at all levels of government and utility managers are struggling with is whether or not rates can be raised to pay for operations and capital improvements and replacements and still be affordable to customers.
Water has generally been so cheap for so long, that people have become attached to the historical price. A final, short lesson is that sustainability costs money.
Author's note: Gregory Baird is managing director/CFO of AWI Consulting LLC. For more information, please email: [email protected].
More Water & WasteWater International Current Issue Articles
More Water & WasteWater International Archives Issue Articles


