Water Reuse In Bahrain's Oil and Gas Industry
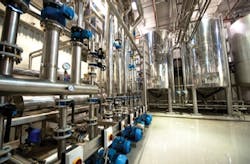
The Bahrain Petroleum Company is in the process of building a new Sanitary Sewage Treatment Plant (STP) to meet stringent regulations. Jamal Kanj discusses an MBR trial plant for the treatment of domestic wastewater.
Bahrain Petroleum Company's (BAPCO) current refinery domestic wastewater system was built back between 1935 and 1940. Effluent is pumped to two underground sumps before being pumped directly into the outlet flume before reaching the sea.
After diluting and mixing with more than 100,000 gpm in the clean water flume, the water quality satisfies existing Bahrain environmental regulations at the receiving end, the sea. However, a regulatory shift meant that new treated effluent would have to comply with Bahrain air and water regulations at the intermediate point of discharge, not just at the sea.
A detailed sewerage treatment feasibility study was then carried out to establish current, future flow demands and to investigate available treatment technologies. The study recommended two well recognized technologies to treat sewage discharge: Sequential Batch Reactor (SBR) and Membrane Bio Reactor (MBR).

Further follow up in-house evaluation recommended the MBR treatment system as the preferred option to meet current environmental regulations and to provide superior water treatment quality for future usage.
Prior to finalizing the system design, an extensive pilot study was conducted using the ZeeWeed® 10 ultrafiltration membrane bioreactor system. The purpose of the pilot plant study was to demonstrate stable membrane performance for the required quality of effluent water, establish full-scale process design parameters for the new plant and to set up effective maintenance cleaning regimes. The pilot plant set out to achieve COD of less than 150 mg/l with or without post treatment, among other requirements.
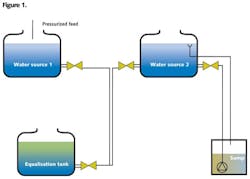
Figure 1 shows the initial setup of the feed tanks. The pilot unit was equipped with four identical bioreactor tanks. Three of the four tanks were fitted with aerators whereas only two tanks were equipped with an agitator. The first tank was used as an anoxic zone and the second tank as an aerobic zone. The equalization tank composition was set up by two other tanks. The feed water overflowed by gravity into the equalization tank.
The first water source was pumped from a manhole sump into a brake tank. That brake was equipped with an overflow back into the manhole and with a connection to the equalization tank. The water traveled by gravity from feed storage tank 1 into the equalization tank. The second brake tank was fed with the second wastewater stream and overflow by gravity into equalization tank.
Feed water was then pumped into the designated anoxic tank in the pilot plant. Sludge from the anoxic tank overflows into the aerobic tank which feeds the filtration tank. Sludge is also recycled between the aerobic and the anoxic tank; excess sludge is removed manually by draining the tanks.
Dissolved oxygen concentration is continuously measured in the aerobic tank and the blower is turned on and off accordingly. Permeate was pumped into the backwash tank for backwash and the surplus was discharged into the drain.
The pilot's study initial investigation revealed that the value of TDS, at least in one tributary area, was much higher than the typical TDS level in comparable sewer systems. The two sewer areas were then isolated and the pilot plant proceeded with testing only one area (North) while BAPCO staff attempted to identify and isolate the source of sea water seepage in the second tributary area (South).
The goal of the plant was to maintain consistent TDS concentration in the feed water to ensure safe biological process. For sudden increases in TDS level causes the dehydration of the microorganisms and reduces their metabolism. On the other hand, abrupt reduction in the TDS level forces the microorganisms to recompense for the osmotic pressure difference between the inside and the outside of the cell wall, causing the bacteria to burst, hence the killing of biomass and reduction in the mixed liquor suspended solid levels.
The main study objective was to establish optimum environment for the activated sludge maintaining proper growth in Mixed Liquor Suspended Solids.
Pilot Plant Performance
The goal of the pilot was predominantly focused on the biological performance. The result showed that the UF performance varied with the stability of the biological system.
The pilot study was divided into two phases: during the first phase, the pilot was fed with a combination of Machine Shop Septic Sump (North) Water and East No. 2 Poly (South) Septic Sump Water. The pilot plant was commissioned with approximately 430 litres of activated sludge. This was divided into 200 litres anoxic volume, 200 litres aerobic volume and 30 litres filtration tank volume. The recirculation between the aerobic and anoxic tank was set at 20 l/h. A flow rate of 25l/h was used for the recirculation between the aerobic and the membrane tank. The hydraulic retention time of the system was approximately a day.
The net permeate flow rate was set at 20 l/h for a duration 600s. After 600s a backwash occurred with a flow rate of 35 l/h for 30s. The pilot plant was supplied with activated sludge from Tubli municipal wastewater treatment plant. Sludge was filtered first through 3mm strainer before transferring it into the two biological compartments. While filling up the biological compartments it was noticed that the MLSS concentration was very low and did not meet the Mixed Liquor Suspended Solids concentration of 2-3g/l. Nevertheless the pilot unit was operated over night in manual mode to aerate the biology continuously. Filtration did not take place during the first night. Feed water was added manually to the biology while biological aeration took place.
The ZW10 membrane module was filled with potable water to prevent it from drying out. Next day the pilot plant was operated in automatic mode to evaluate its performance. After several hours of operation, more sludge was brought in to increase the MLSS concentration in the system. One day later additional 60l of sludge were added into the anoxic and aerobic tank. The unit was kept in operation in order to recirculate the sludge in the system. The flow of the different hose pumps was measured and according to the readings the speed of the pumps were adjusted to achieve the design criteria.
The first operational data was collected to evaluate the operational performance. In addition other samples were taken from the feed water as well as permeate and biological zones to evaluate the biological performance.
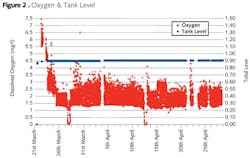
Figure 2 illustrates the development of the dissolved oxygen concentration. As shown above, the DO concentration declined at first and remained stable afterwards. The DO concentration varied between 1.5 mg/l and 3 mg/l throughout that phase of the pilot study. The blower for the biological aeration starts once the DO concentration drops below 1.5 mg/l and stops when DO concentration reaches 2.5 mg/l. Due to the delay the DO concentration increases further to 3 mg/l.
In addition, the graph also represents the level in the anoxic tank. The blue line represents the level. Feed water added to the anoxic zone, hence the level must be monitored. The raw water pump starts at 89 cm and stops at 91 cm level.
The speed of the pump is set approximately at the same value as the net permeate flow rate in order to ensure continues operation; however the flow of the feed pump is not regulated by the level in the tank, it just starts and stops the pump.
Feed water COD concentrations of 1400m/g were expected. Figure 3 represents the actual COD concentration of the feed water throughout the pilot study, phase one. The blue graph represents the COD concentration of the blended feed water. The COD concentration fluctuated rapidly and was unstable during this phase. Swings in the COD concentration in the range of 10 to 15% per day can be tolerated for proper biological operation.
As a result to the feed water fluctuation, the effluent COD did not meet the discharge requirements per the EPC contract. The contract COD discharge limit was 150 mg/l as shown in Figure 2 in red. The effluent COD concentration is directly related to the level of COD load in the system. An elevated COD load results in high COD in the effluent.
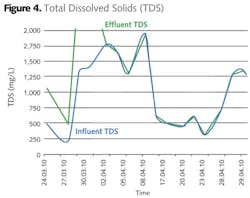
In addition unstable Total Dissolved Solids (TDS) in the effluent may contribute to higher COD level. The graph below illustrates TDS concentration during the first five weeks of pilot testing.
As shown in the graph, the TDS concentration fluctuated frequently resulting in disturbing the biological growth. The sudden shift in TDS levels led to MMLSS [Mixed Liquor Suspended Solids] decline, whereby the effluent qualities failed to comply with the required discharge criteria. Proper biodegradation and nitrification demands stable activated sludge. Volatile feed water characteristic degrades the effluent quality whereby the plant will need to be re-seeded with new activated sludge.
Nevertheless the COD removal was in the range of 93% most of the time. The COD reduction decreased to 65% as TDS fluctuated from 17g/l, 13g/l and then back to 19g/l took place within a time period of five days. During that time the osmotic pressure varied significantly in the sludge cell causing the bacteria to explode, hence lowering the biodegrading rates.
The swing in TDS values was not anticipated and neither the design of the full scale plant or the pilot plant predicted this variation. The initial test data by BAPCO showed the TDS value below 1500 mg/l.
Another important feed parameter was the temperature. The membrane specification requires the temperature to be below 40°C and less than 38°C for successful biological process. A temperature probe was installed in the equalization tank and depending on the ratio of the two different wastewater streams, the temperature increased or decreased. In the first five weeks of the pilot study the temperature did not exceeded 38°C in the equalization tank.
Conclusion
Collected data from the three month study provided a good insight into the quality of the feed water and treatment at the refinery:
• The pilot study proved that further evaluation of the feed water is needed
• The TDS concentration was much higher than the level specified in the RFP (1500 mg/l)
• The COD was higher or lower than the specified levels depending on the water source treated, north or south tributary area
• Sudden TDS fluctuation of more than 15% was detrimental to bacteria and MLSS growth. Further this condition disrupted sludge aging process, hence interrupting the population of nitrifyers, corollary disrupting full nitrification
• The required COD limit of 150 mg/L is achievable once the TDS fluctuation is controlled
• Total phosphorus limit of less than 1 mg/l can be achieved with coagulant addition. Coagulant will be required but this can be added during full scale design
• The feed water temperature during the summer time (June to August) exceeded the permissible levels for MBR systems
• A larger Equalization tank may be required to reduce the impact of the TDS fluctuation.
Author's note: Jamal Kanj, PE is project leader for the Bahrain Petroleum Company (BAPCO). For more information please email: [email protected].
More Water & WasteWater International Current Issue Articles
More Water & WasteWater International Archives Issue Articles