By Matthew Barker
The last year or so has seen the water sector increasingly generating a great deal of interest from the investment community and it has caught the attention of Wall Street and investors recently, as generally it has not been well covered by the financial community. This is not without good reason: from an estimated $104.9 billion in 2003, the US water industry is expected to grow at around 7 percent annually to $150 billion by 2010. Despite the rapid growth in demand, the supply of water is becoming scarce. As per the Environment Protection Agency (EPA) estimates, $138 billion needs to be invested by 2016 to upgrade/replace the water infrastructure to comply with the safety standards prescribed by the Safe Drinking Water Act alone.
Frost & Sullivan Water Industry Stock Index
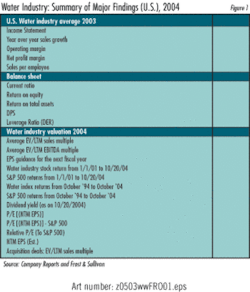
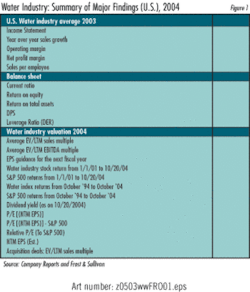
Water stocks have proven to be a good place for investments over the last 10 years. The Frost & Sullivan Water Industry Stock Index (WISI) provided a return of 16.6 percent over October 1994 to October 2004 against a return of 9.0 percent by S&P 500. Even on a shorter duration, from January 1, 2001 to October 20, 2004, the WISI’s return was 58.4 percent against a negative return of 18.4 percent from S&P 500.
The price-to-earnings ratio of the water industry relative to the S&P 500 is 1.4x. Compared with the stock returns, a relative multiple of 1.4x suggests that the water industry is valued to reflect additional growth, and potentially further out-performance.
In terms of valuation, the water sector is trading at a multiple of 2.8x in terms of the Last Twelve Months (LTM) sales, and at 16.0x in terms of LTM EBITDA. Publicly traded water utilities command the highest valuation multiple in terms of LTM sales, and water equipment companies command the highest valuation multiple in terms of LTM EBITDA.
Water equipment companies have historically yielded the highest stock returns. However, the utilities distribute the largest dividend payouts, as seen by their dividends per share and dividend yield.
One item of note is the high operating margins for the water utilities. Although the industry-wide operating margin is only 17.7 percent on an average per year from 1995 to 2003, the same is an impressive 28.6 percent for the water utilities over the same period. Water utilities also outperform the other groups in terms of the net profit margin. This should be seen in conjunction with the employee productivity level. The water utilities have clocked the highest sales per employee consistently from 1995 to 2003. This is almost $50,000 more than the industry average. While utilities and equipment companies are different businesses, thus do not represent a fair comparison, the directional trends that we see when we analyze the various sectors of the industry are what we pay close attention to.
Mergers and acquisitions are completely changing the competitive landscape in the US water treatment equipment market. It is a clear indication of market consolidation. Take over of US Filter Corp. by Siemens AG from Veolia Environment (Formerly Vivendi) has put Siemens on the top of the global map. Acquisition of Ionics by General Electric is another calculated move in the market towards consolidation. Infilco Degrémont continues to develop a strong foothold in the municipal water treatment equipment market. Siemens sees its billion-dollar purchase as a strategic move to compete with General Electric in the North American market. The company hopes that synergetic benefits arising from the expertise of Siemens and US Filter will make Siemens a strong and attractive partner for our customers in the water industry.
Growth Monitor
The Frost & Sullivan Growth Monitor provides a measure of the future growth prospects of a company, as compared with its competitors. An important feature of the growth monitor is that it allows comparison within and between industries. Financial analysts use it to take an initial look at the major participants in a specific industry and their growth profile based on their current product or business profile.
The Growth Monitor looks at two key measures: The growth rate of the different segments that the company is into, and the revenue that the company generates from each of those segments as a percentage of the aggregate revenue generated by the company. Finally, a weighted industry growth rate for each company is generated based on its current sector exposure and the relative five year compound annual growth rates (CAGRs) for each segment. This is the weighted growth number, called the score, for the company, arrived at using the growth rate for each sub-segment and the percentage of sales coming from that particular sub-segment as weight.
The higher the score, the larger the percent of sales a company generates from sub-segments showing a high growth potential. A near zero (negative) score would indicate that a company is still betting on a technology that has near-zero (negative) growth potential, or is in a greater percentage of markets that have matured or do not for some reason provide the growth opportunities of other segments.
It may indicate that the company has not kept pace with the latest developments in technology. The reverse is true of companies that have high scores. Hence, potential investors will be better equipped to pick the likely winners, both in terms of specific companies and industries.
Looking at the technologies that are performing strongly, we see ultraviolet disinfection, ion exchange, membranes treatment, gravity filtration, and electrodialysis are the fastest growing sub-segments among water equipment sales. On the other hand, filtration (pressure sand), incineration, chlorine disinfection, and digesters are among the sub-segments showing the slowest growth. Obviously, a company that has a large percent of sales coming from a segment showing a high growth rate is better poised to perform in the future than a company that has a higher percent of sales coming from a sub-segment that has a growth potential of negative or near zero.
The future performance of the companies depends on how quickly they can identify the opportunities and adopt new technologies. The important link between these is innovation. It is also important to note that certainly there will be companies that will organically “outgrow” the industry growth rates identified for each segment.
The growth monitor is designed to provide a snapshot of the companies in these segments, and it does not reflect prior years growth or outperformance for any company. Moreover, specific companies may have specific industry, geographic, or customer exposure within a specific sub-segment which can also present opportunities for companies to either under or outperform the segment growth associated with each market sector.
Growth rates for the top 20 companies are presented in Figure 2.
About the Author:
Matthew Barker is Program Manager for the Water & Wastewater Group at Frost & Sullivan.


