By Eric R. Mortensen, Tzahi Y. Cath, Jonathan A. Brant, Keith E. Dennett and Amy E. Childress
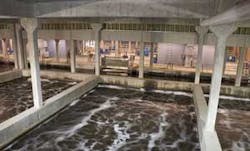
The Truckee Meadows Water Reclamation Facility (TMWRF) is a 150,000 cubic meters per day wastewater treatment facility that discharges into the Truckee River – the main source of water for Nevada’s Pyramid Lake. Conservative substances such as salt discharged to the river accumulate in Pyramid Lake and have caused the salinity of the water to nearly double since 1933.
The total maximum daily load (TMDL) for TMWRF’s discharge of Total Dissolved Solids (TDS) has been set at 54,500 kg/day. Dissolved solids discharged to the river can promote eutrophication, destroy sensitive ecosystems and threaten endangered species (i.e., cutthroat trout and cui-ui fish) in the river and lake.
To accommodate future growth in the Reno/Sparks metropolitan area, the facility is expected to reach a new capacity of 176,000 cubic meters per day in approximately 15 years. Using the current average effluent TDS concentration of 375 ppm, the expansion would result in a TDS discharge of approximately 66,000 kg/day. To satisfy the TMDL for TDS discharge to the Truckee River, TMWRF would have to reduce its TDS loading by approximately 11,500 kg/day.
Reverse osmosis (RO) and nanofiltration (NF) are pressure-driven membrane processes used to remove TDS from water. Many studies and full-scale applications have established RO as a suitable membrane process for wastewater reclamation and reuse. Examples of successful RO wastewater reclamation projects have been summarized in two comprehensive studies. However, fewer studies have been published on the use of NF for wastewater reclamation, particularly for removal of TDS from secondary or tertiary effluent.
When using membrane processes in wastewater treatment, the quality of the feed water is of critical importance due to problems associated with membrane fouling. Dissolved matter, colloids, suspended particles and microorganisms that are present in secondary or tertiary effluent will accumulate on the membrane surface and result in loss of performance, possible membrane damage and increased operating costs.
The objective of this investigation was to evaluate the feasibility, efficiency and limitations of using RO or NF membrane processes to reduce TDS loading from TMWRF into the Truckee River. Specifically, this study focused on:
null
null
Bench-Scale Studies
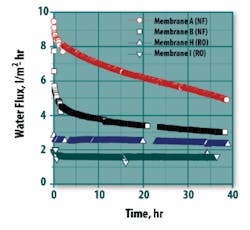
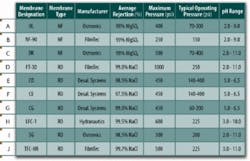
Four membranes were chosen for bench-scale investigation based on results from short-term stirred-cell experiments. These included two NF membranes (A and B from Table 1) and two RO membranes (H and I). A substantial difference in the initial water flux was observed for the four membranes (Figure 2). As expected, both NF membranes had higher initial fluxes compared to the RO membranes. A large difference in the initial specific flux was also observed between the two NF membranes due to the inherent differences in membrane resistance.
As time progressed, fouling effects resulted in considerable flux decline for the two NF membranes. The large drop in flux relative to the RO membranes can be attributed to pore plugging and enhanced concentration polarization due to the higher water flux for the NF membranes.
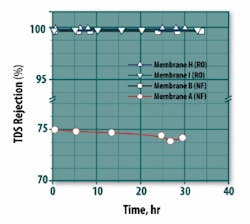
Results for TDS rejection for the four membranes are shown as a function of time in Figure 3. It was expected that the RO membranes would have a higher rejection than the NF membranes; however, membrane B, an NF membrane, also had a very high TDS rejection. Membranes B, H and I had greater than 99.5 percent TDS rejection; membrane A rejected less than 80 percent.
Based on this and the high flux observed for membrane A, it was confirmed that membrane A is indeed a ‘looser’ NF membrane. This observation was not necessarily anticipated based on the manufacturers’ data where the average rejections of membranes A and B were reported in percentage MgSO4 rejection and were only different by 1 percent.
Based on the bench-scale test results, membranes A, B and H were selected for pilot-scale testing. Membrane H (RO) was selected because it had a higher initial flux than membrane I, minimal flux decline and high TDS rejection. Membrane B (NF) was selected because it had a higher flux than the RO membranes, and it also maintained high TDS rejection throughout the 38-hour bench-scale test. Membrane A (NF) was selected to represent a looser NF membrane with high flux and low rejection.
Pretreatment Analysis
Previous studies have demonstrated that microporous membrane filtration processes (e.g., MF or UF) can efficiently pre-treat effluent water prior to treatment with RO or NF. Run times can be extended and the frequency of membrane cleaning can be reduced. Thus, a pilot-scale UF system was tested as a pretreatment process for the RO/NF pilot system.
The flux decline without pretreatment was determined to be unacceptable; therefore, the UF system was installed to operate for the pilot scale runs.
null
Pilot-Scale Studies
Pilot-scale experiments were conducted at the treatment plant for each of the three RO/NF membranes selected using a three-stage high pressure membrane skid.
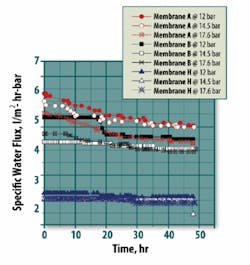
Specific water flux as a function of time and transmembrane pressures are illustrated in Figure 4. All of the membranes experienced decline in specific flux as the transmembrane pressure increased. The higher permeation rates at higher pressures led to enhanced transport of foulants to the membrane, greater compaction of the fouling layer and increased hydro-dynamic resistance.
Flux decline during the pilot tests occurred slower than flux decline during bench-scale experiments, likely due to the UF system. Results from the pilot tests (Figure 4) corresponded well with results from the bench-scale experiments. Membranes A and B – the NF membranes – experienced gradual flux decline while membrane H – the RO membrane – produced a more constant flux.
Membrane A had the highest initial flux and fastest flux decline at both bench and pilot scale. However, in the pilot tests the initial sharp flux declines for membranes A and B were not apparent. It’s likely that the large surface area and improved hydrodynamics in the spiral wound elements prevented rapid fouling at the early stages of the pilot tests.
Membrane H, the RO membrane, had the lowest flux decline both during bench- and pilot-scale testing. This is most likely due to its lower flux, therefore, producing lower drag forces toward the membrane. Higher temperature of the feed water during pilot testing may have contributed to the slightly higher flux of all the membranes at pilot scale.
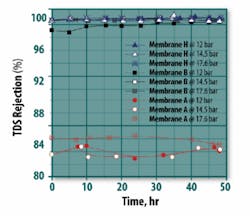
TDS rejection as a function of time and transmembrane pressure is shown in Figure 5. Membrane H provided the highest TDS rejection, as expected for a tight RO membrane. Membrane A, the looser NF membrane, provided the lowest TDS rejection. TDS rejections for both membranes B and H were generally greater than 99 percent.
Membrane B provided less than 99 percent TDS rejection at the beginning of the lowest pressure experiment but rejection increased to greater than 99 percent as time progressed. Rejection in the higher pressure experiments was greater than 99 percent at all times.
This difference in rejection at different transmembrane pressures can be explained by two possible mechanisms. First, when the new membrane B was introduced to treated wastewater during the low transmembrane pressure experiments, rapid pore blockage likely occurred over the first 24 hours. This would have tightened the membrane and caused increased rejection of smaller contaminants over time.
Theoretical Energy Consumption
Performance results from pilot-scale testing were used to calculate the theoretical energy consumption of each membrane tested. As expected, the specific power consumptions for the NF membranes were lower than that of the RO membrane. Although the theoretical power consumption results indicate that NF is favorable to RO, it is important to note that high rejection (in addition to high flux) is desirable in order to reduce the volume of water that requires treatment, thereby reducing capital investment and membrane replacement costs.
In addition to an energy calculation, each membrane tested was modeled using the manufacturer’s software to simulate a full scale plant. It was found that approximately 8 percent (by volume) more water needs to be treated if NF is used instead of low pressure RO. Thus, in order to more comprehensively compare NF and RO processes for this application, an optimization program that considers more than just energy consumption would need to be used.
null
Preliminary Cost Estimate
A preliminary estimate of the capital costs for the implementation of an 8 MGD UF/NF system at TMWRF is approximately $4.3 million for capital equipment and $3.2 million for miscellaneous works (e.g., new buildings, electrical supply and other infrastructure). Operational and maintenance costs were estimated to be approximately $0.88 per 1,000 gallons of water produced.
Conclusions
Based on membrane performance during pilot-scale experiments, membrane processes can be implemented at TMWRF for TDS and nutrient removal from the effluent water. NF membranes have shown to be effective in rejecting TDS while maintaining higher flux and lower specific power consumption.
Long-term pilot experiments should be conducted to study the longer-term fouling effects on the performance and economy of the process. WW
About the Authors:
Eric R. Mortensen is a civil engineer in training based in HDR’s Reno, Nev., office. Tzahi Y. Cath is an assistant professor at the Colorado School of Mines, Division of Environmental Science and Engineering in Golden, Colo. Jonathan A. Brant is a drinking water/applied research engineer in training based in HDR’s Bellevue, Wash., office. Keith E. Dennett is an associate professor at the University of Nevada, Reno, Department of Civil and Environmental Engineering. Amy E. Childress is an associate professor at the University of Nevada, Reno, Department of Civil and Environmental Engineering.
