by Lew Brown
Enumerating the algae content of a water sample typically involves manual counts through a microscope. Recent advances in imaging particle acquisition hardware and automated pattern recognition software enable these counts to be automated. The new techniques have the potential to advance the sensitivity of monitoring systems by providing much more information on the state of the water supply in near-real time, with more statistical significance than conventional microscopy. The availability of this information will permit a much tighter "feedback loop" for quality monitoring, and therefore can yield significant cost savings by allowing system operators to proactively treat water supplies.
While the example used here will be specific to quantifying taste and odor causing algae in a drinking water supply, the same techniques can be used for other water applications, including wastewater monitoring.
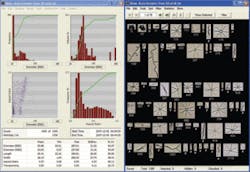
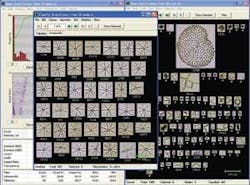
For this article, a water sample was obtained from a municipal drinking water supply. The sample was then run through the FlowCAM®, an in-flow imaging particle analysis system available from Fluid Imaging Technologies. Images are acquired and stored of each particle found in the sample. Each particle image has associated with it up to 26 different measurements. The number of measurements gathered per particle is important in that higher numbers of measurements allow for finer discrimination of different particle types by the pattern recognition software. The results of the data acquisition can be seen in Figure 1.
In this particular example, we are interested in quantifying two taste and odor causing algae, Asterionella sp. and Tabellaria sp. We will use a statistical pattern recognition algorithm in order to classify the types of algae found in the sample. This classification is called a supervised classification because it requires the operator to first define libraries (also sometimes referred to as "training sets") of particles of the type one wishes to enumerate in the sample.
This is quite simple to accomplish using the VisualSpreadsheet© software supplied with the FlowCAM: one merely pages through the particle images and identifies (by clicking on) those images which are of the species one is interested in looking for. Once these images are identified (usually 10 or more images are used; higher discrimination can be achieved with greater number of images), they are stored in the system as a library.
This same process is then repeated for each type of particle that it is desired to enumerate in the sample. Once the libraries are built, then the statistical pattern recognition can be performed simply by the click of a button on the software menu.
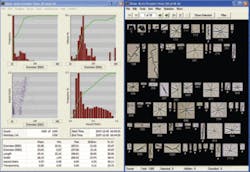
As noted in Figure 2, although the two species of algae we wish to enumerate seem quite clearly different to the human eye, they are not as easily distinguished mathematically. Automated pattern recognition in images has been a complex area of research within computer science for many years; indeed, many distinctions we make regularly through our eye/brain remain very difficult to accomplish computationally.
As stated previously, one of the main requirements for statistical pattern recognition to produce good results is to have as many data points (in this case, image measurements) as possible for each particle image. The majority of these measurements captured are spatial in nature, although gray-scale measurements (such as intensity, transparency, etc.) are also of great value. Since the majority of the measurements are spatial in nature, the statistical pattern recognition is highly sensitive to the resolution of the source images.
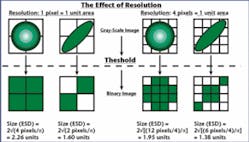
Figure 3 is a simplified diagram showing how increased spatial resolution results in higher accuracy of spatial measurements. In image processing, measurements on objects are made on a binary image created from the original image via gray scale thresholding. As we can see, higher resolution original images yield a substantial increase in the level of detail which can be extracted from the binary thresholded image.
Many "higher order" image understanding measurements require sufficient amounts of image resolution in order to be calculated. For example, a measurement called "circularity" is calculated by comparing the theoretical perimeter of an object based upon its ESD (perimeter of a circle having that diameter) versus the actual measured perimeter. This can only be accomplished if enough resolution is present to make a meaningful measurement of the actual perimeter.
Results
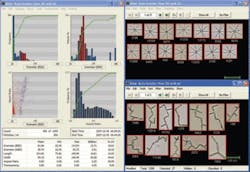
Now let us take a look at the results found when running an automated statistical classification on the water sample data previously acquired, using the two libraries built as shown in Figure 2. It is important to note that once a library is built for a particular type of particle, it can be used repeatedly to enumerate particles in additional samples. This means that the same statistical evaluation is performed on each sample, which normalizes the results (reducing the error that is commonly found in manual microscopy due to differences in operator interpretation).
The results of the statistical classification can be seen in Figure 4. The lower part of the left hand window shows the summary statistics for the overall run: out of 1,305 original particles in the run, 507 were classified as Asterionella (with a concentration of 663 particles/ml) and 33 were classified as Tabellaria (with a concentration of 43 particles/ml). The right hand window shows remaining particles that were characterized as "unclassified". At this point, if desired, the user can interactively edit the classification to include particles which were not selected or remove particles which were selected. This is generally only required in very sparse samples where absolute enumeration is required.
Even if further editing is warranted after the classification has been performed, the time savings generated from using this method as opposed to manual microscopy are very significant. Additionally, since this technique enables analysis of significantly larger quantities of particles in less time, the results obtained through this methodology produce much higher statistical significance and confidence. This time savings plus larger amounts of data being analyzed enables the use of such techniques in applications where performing manual analysis through a microscope would be cost and time-prohibitive. In fact, it opens up the possibility of near real-time monitoring, which leads to a tighter "feedback loop" when monitoring any process.
A more detailed discussion on pattern recognition theory and techniques is available in a white paper entitled "Particle Image Understanding - A Primer" located at www.fluidimaging.com/imaging-particle-analysis-white-papers.aspx.
About the Author:
Lew Brown is Director of Marketing for Fluid Imaging Technologies Inc. Prior to joining the company full-time, he served as a consultant to the company and other companies involved in digital image processing and analysis. He has 25 years experience in the digital imaging and computer graphics industries, and holds a Bachelor of Science Degree in Imaging Science from Rochester Institute of Technology in Rochester, NY.
