By Allan R. Budris
The writer recently received a question from a reader regarding deviations the reader was experiencing between the pump factory head-capacity (H-Q) performance curve and what was being observing in the field. The field (H-Q) curve was steeper with a higher shut-off head.
The first thought, based on observations from many field tests, was that the pump head and capacity differences were most likely due to non-calibrated field instruments, and/or non-optimum piping to the pump and/or instruments. Field Bourdon pressure gauges are notorious for their questionable accuracy, if they are not periodically calibrated. By contrast, factory pump performance tests are typically conducted according to the test requirements of the Hydraulic Institute Standards, using cold water with sufficient NPSH available, which results in reasonably accurate results, for the specific conditions and pump tested.
Factors that can change pump performance:
There are, however, other (mostly field) conditions that can actually change the pump field H-Q and/or HP-Q (Horse Power-Capacity) performance, compared to the factory conducted results, many of which are tabulated below:
1. Operating a pump in reverse (wrong direction) will have a very large impact on the pump performance, resulting in a much steeper (lower flow rate) H-Q curve. This most often happens on initial startup.
2. Published (pricebook) factory pump performance curves will likely differ from the specific pump performance, due to impeller and casing manufacturing (geometry) tolerances. So unless the specific pump was factory tested, some actual performance variation would be expected.
3. Liquid viscosities above approximately 40 to 100 SSU will decrease centrifugal pump head, flow and efficiency, while increasing the input power. The Hydraulic Institute standards provide charts to help estimate the viscosity performance impact for a specific pump.
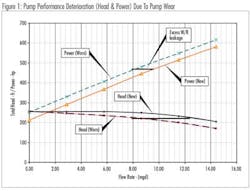
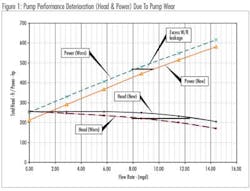
4. If the pump has been installed for some period of time, any pump wear, such as opening up of the impeller wearing ring clearance, will change (decrease) the pump performance (see figure 1). Further, when a pump is rebuilt it may still not fully meet the original performance due to any deviations in the geometry of the replacement parts, especially if they are not manufactured by the pump vendor (see February 2010 column).
5. Besides pump wear, pumps handling solids, such as sewage pumps, are often subject to plugging of the impeller, which will reduce the pump head and flow. Momentarily reversing the pump rotation can often unplug the impeller.
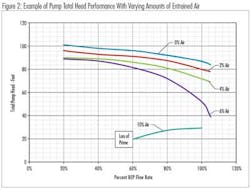
6. If the pump is forced to handle more than about one percent entrained air, the head-capacity performance will be reduced, as show in last month's Pump Tips column on pump priming (see figure 2).
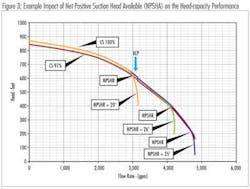
7. The cavitation vapors generated when there is insufficient Net Positive Suction Head Available (NPSHA) to the suction of a pump can block the through flow (see figure 3.). A centrifugal pump can handle a fair amount of cavitation vapor, but at some flow rate / NPSHA the flow rate will fall off quite rapidly.
8. At low (or shut-off) flow rates, deviations in head from the factory curves could be due to recirculation in the suction, and/or discharge pipes. Not only can this give lower pressure gauge readings due to the higher recirculating liquid velocities at the pressure gauges, but it can also affect the discharge head due to circulation inside the pump volute and impeller. Pump recirculation can extend 5 to 10 pipe diameters or more from the pump. Discharge recirculation can travel all the way to the discharge valve, and back. This means that different discharge piping geometries could result in different discharge shut-off heads. Years ago, when the writer worked for Worthington Pump, their laboratory had to measure the suction pressure in the suction tank (instead of the suction pipe), at very low flow rates, in order to obtain accurate suction pressure readings.
In addition to the above potential variations in pump head-capacity performance; system H-Q curves may also differ from their original design specifications for various reasons, such as changes in the system pipe friction. Remember, the pump will always operate at the intersection between the actual system (field) H-Q curve with the actual pump H-Q curve.
So what is a pump user to do when he suspects that his pump is not performing up to factory specifications?
Recommended Actions for New, Factory Tested Installations:
If the pump has been performance tested at the factory, and it is a new installation, the first assumption should be that the factory test is correct, and the difference is due to some system condition. The following issues should be checked to help identify the root cause of the apparent performance variation, plus it might also point to a corrective action:
1. The pump direction of rotation should be checked to see if it is correct.
2. The suction pressure should be measured to insure that the pump is not experiencing excessive cavitation. It can take from 1.05 to 2.5 times the NPSHR of the pump, just to prevent any head loss from cavitation blockage (see January 2012 column). The suction pressure gauge should be calibrated for this measurement.
3. Insure that the pump is not handling a viscous liquid, and if so the performance is corrected.
4. Insure that the pressure, flow and power measurement gauges have recently been calibrated.
5. Determine if the field head and power measurements, for identical flow points, match constant flow points on the factory H-Q and HP-Q curves, even if the field and factory flow rates for these conditions do not agree. This could question the accuracy of the field flow measurements. If the pump power curve is not too flat, the HP-Q curve can be used to approximate the pump flow rate, if the pump is not worn. Remember to take the motor efficiency into account.
6. Check to see if the pump could be operating at a low flow rate, which could cause suction and/or discharge flow recirculation (see June 2010 column). This might lower the pressure gauge readings.
7. Make sure that elevation and velocity (V2/2g) heads have been taken into account in the total pump head calculations (see January 2009 column).
8. Check to insure that the assumed system H-Q curve is still valid.
Recommended Actions for Older, Non-Factory Tested Pumps:
If the specific pump has not been factory tested, and/or the pump has been in service to some period of time, a calibrated factory test may be required to obtain more accurate performance results (see January 2009 Pump Tips column). This can also help identify the cause of the apparent performance problem.
If the pump user does not have the expertise and/or equipment required to conduct such a calibrated test and/or evaluation, the user may want to turn to a knowledgeable pump consultant, distributor or factory representative.
Future Columns:
The writer would like to hear from other pump users who might have their own pump application or field problems which they you would like to see covered in a future Pump Tips and Techniques column. The writer can be reached at his e-mail address ([email protected]).
About the AuthorAllan R. Budris, P.E., is an independent consulting engineer who specializes in training, failure analysis, troubleshooting, reliability, efficiency audits and litigation support on pumps and pumping systems. With offices in Washington, NJ, he can be contacted via e-mail at [email protected].
