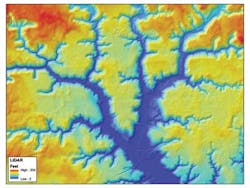
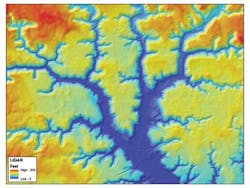
The Northwest Florida Water Management District recently launched a new website that makes it easier to find detailed information about elevation and surface features of northwest Florida properties. The website features an updated, colorized relief map produced by LiDAR (light detection and ranging) technology.
The District partnered with the National Oceanic and Atmospheric Administration (NOAA), U.S. Geological Survey, U.S. Air Force and local communities to acquire the detailed LiDAR data across the panhandle. To gather the data, LiDAR equipment attached to airplanes sent out laser light pulses at high frequencies and measured elevation from the return beams. Land surface elevations were retained by filtering out structures and trees.
The new data was compiled into a web mapping application that makes it easy to access in a variety of formats and for specific geographic areas. Website visitors are able to see contour elevations for specific areas, such as land around homes or businesses, and can click any point on the map to display the elevation for a specific location. The website also offers a "clip-zip-ship" function that allows users to select areas of interest, extract, zip and export data into a downloadable file.
"Collecting and compiling the most accurate and up-to-date data is a vital part of protecting and managing the water resources of northwest Florida," said District Executive Director Jon Steverson. "By making this information publicly available, we're ensuring that our residents and communities have the tools they need to make informed decisions about land use and potential flood risks."
The LiDAR website provides information that is ten times more detailed and visual than old topographic maps, serving as an important tool for many of the District's water resource management and flood protection functions. For example, the interactive maps are improving the engineering analysis used by District hydrologists, who can now look at smaller elevation changes in the landscape and accurately model how stormwater drains from yards, streets and neighborhoods into nearby lakes, ponds and streams.
"This information is a valuable tool for many of the District's water resource projects, including managing and protecting wetlands, floodplains and other water resources," said Nick Wooten, Chief of the District's Bureau of Surface Water. "We will use this data as we continue to refine and improve floodplain mapping and water management activities throughout the district."
The website's colored relief display helps users visualize topography by using hillshade relief imagery that illustrates small changes in land elevation with colorized views of the land surface. The elevation of property, relative to its surroundings, determines how and where water flows. The LiDAR relief color ramp (scale) changes with a zoom tool so that even close-up views reveal neighborhood slopes and relief.
Residents and technical experts can access this detailed data online and use it for activities ranging from landscaping and building construction to evaluating flood risk. For instance, planners can use the information to make better decisions about comprehensive planning and zoning regulations since colors created by LiDAR elevation data make it easier to determine basin boundaries. Previously, developers may have needed a property survey or used contour lines on the U.S. Geological Survey quadrangle maps for site plans. Now LiDAR relief images help visualize the lay of the land.
LiDAR maps are also easier to interpret for drainage and engineering analyses. Engineering consultants can use LiDAR to plan the drainage for new construction projects, which can lead to reduced surveying costs and better predictions about the post-development impacts of stormwater runoff.
The LiDAR relief display also helps visualize the boundaries of a basin by colorizing land surface elevations to clearly identify the divide between basins. Hydrologists and engineers can take an area of interest, such as a bridge or structure, and calculate the size of the contributing drainage area. They can then determine the acreage within the basin that drains towards the bridge. With this and various land use data, such as impervious surface area, soils and land cover, they can calculate the runoff and flow rate under the bridge for various storm events. Most bridge decks, for instance, are above the 100-year flood stage, which is the flood-stage that stormwater has a 1 percent chance of exceeding in a single year. The improved resolution of the topographic data provided by LiDAR increases accuracy for flood studies and the resulting 100-year flood elevations.
The LiDAR data is a useful tool for more detailed delineation of drainage areas, improved runoff calculations and designing stormwater facilities that are cost-efficient and effective. By using better data, communities are able to plan and construct new developments that off-set and minimize impacts to downstream property and water resources, and more effectively control both the quality and rate of urban runoff.
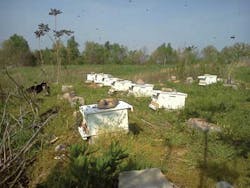
Along with the many technical purposes the District's LiDAR website serves, a few creative residents have found ways to take advantage of this cutting-edge technology. For example, a beekeeper near Panama City is using the map to identify the best areas to place his beehives. Because his bees can use up to three or four gallons of water to cool each hive in the warm months, the LiDAR site is helping him identify low-lying areas with standing water for honey production. In another instance, a local engineer and Tallahassee runner uses the LiDAR website to plan routes that avoid steep hills.
The new website is available at www.nwfwmdlidar.com.
In November 2012, Veolia crews descended into Milwaukee’s Deep Tunnel to remove two decades worth of trash, including plastic bottles, tennis balls, wood and other floating debris. Deep Tunnel, Deep Clean


