The Environmental Protection Agency recently released for public comment its draft 2007 Report on the Environment (ROE): Highlights of National Trends. First issued in 2003, the report is designed to help the average citizen follow national trends in the condition of the air, water, and land.
In the water portion of the report, EPA provides an update on the condition of surface water, groundwater, drinking water, wetlands, recreational waters and coastal waters. In each section of the report, the agency briefly discusses the issues and concerns of water quality, and provides current condition assessments. It also points out where additional research or monitoring is needed.
The report provides an overview of national-level trends where nationally consistent data are available, but does not describe the extent or condition of local water bodies or the full range of variations and extremes that occur within individual water bodies.
The following article provides excerpts from the report. A full copy of the ROE draft is available at www.epa.gov/roe.
Fresh Surface Waters
A variety of biological, physical, and chemical characteristics are used to assess the condition of fresh surface waters. An important biological characteristic is the presence and diversity of bottom-dwelling (benthic) macroinvertebrate communities, such as insect larvae, mollusks, and worms. Some species of macroinvertebrates are sensitive to disturbances in their habitat, such as pollution, while others are tolerant of disturbances.
Examples of physical characteristics are depth and flow. Major changes in stream flows can affect plant and animal species that have adapted to particular seasonal fluctuations in flow, such as those that require a period of low or no stream flow in their habitat at a certain time of year.
Key chemical characteristics include acidity and dissolved oxygen. Acidity in soils, lakes, and streams can harm aquatic species and ecosystems. Low dissolved oxygen content can also be harmful. Excess concentrations of the nutrients nitrogen and phosphorous (from sewage or agricultural runoff, for instance) can cause algae to bloom in water, blocking sunlight and depleting the oxygen needed by fish and other organisms.
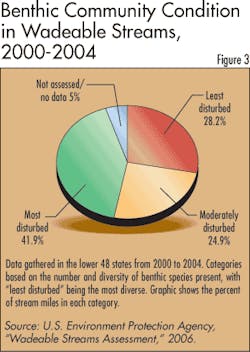
In about 42 percent of wadeable stream miles, benthic macroinvertebrate communities showed substantial disturbances; about 28 percent showed little disturbance. Low biological diversity potentially indicates significant pollution and higher disturbance. By contrast, communities that are biologically diverse and include many pollution sensitive species likely indicate that a stream is less disturbed.
More than 60 percent of streams and rivers measured in the 1990s showed major changes in the volume or timing of their high or low flows compared to a baseline period from 1930 to 1949. Also, the percentage of streams in largely arid grasslands and shrublands with no-flow periods decreased from 24 percent in the 1950s to 14 percent in the 1990s.
Fresh surface waters show a mixed picture of chemical condition. Acidity decreased in lakes and streams in some regions sensitive to acid rain; others showed little change. Approximately 30 percent of the nation’s wadeable stream miles contained high nitrogen and phosphorus concentrations. Nitrate discharges increased in the Mississippi River. Phosphorus discharges decreased in the St. Lawrence and Susquehanna Rivers, but showed no change in trend in the Mississippi or Columbia Rivers.
National indicators are not available for many key stressors or for the extent of surface waters. Key stressors include pollution from various sources and toxic contaminants in sediments, which can impact water quality and potentially enter the aquatic food web.
Ground Water
More than 1 million cubic miles of fresh water lies below the Earth’s surface. The vast majority of fresh water available for human use is ground water, which has 30 times the volume of the world’s fresh surface waters. By some estimates, ground water feeds about 40 percent of total national stream flow, and the percentage could be much higher in arid areas.
About 61 percent of shallow wells tested in agricultural areas contained pesticide compounds. For 47 of the 83 pesticides for which standards or guidelines exist, fewer than 1 percent of these wells had concentrations of pesticides above the human health benchmark.
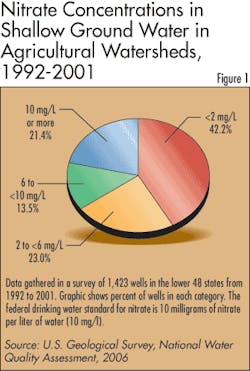
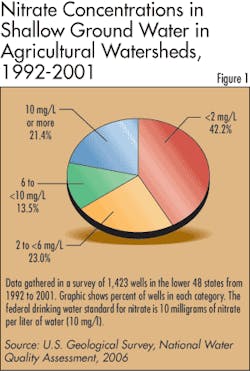
In about 21 percent of shallow wells, average nitrate concentrations exceeded the federal drinking water standard and were significantly higher than the levels generally found in areas with little human influence.
The data in the EPA report does not provide information about the condition of deeper aquifers, which are more likely to be used for public water supplies. Data only characterize the uppermost layers of shallow aquifers typically used by private wells.
There are no consistent national indicators for many aspects of ground water condition or extent. These aspects include the presence of chemicals other than nitrates and pesticides in agricultural areas and the condition of ground water in predominantly non-agricultural areas, including urban areas. Localized events, such as chemical spills or leaks from underground storage tanks, can affect ground water in urban areas; such events are not easily captured in measures at the national level.
Drinking Water
Virtually all drinking water in the United States comes from fresh surface water and ground water. These source waters can contain industrial, domestic, and agricultural contaminants, as well as naturally occurring contaminants such as arsenic and radionuclides. Also, some contaminants, such as lead from corroded pipes, can enter drinking water between the treatment plant and the tap.
In 2005, 89 percent of community water system customers were served by facilities for which states reported no violations of EPA’s health-based drinking water standards.
Approximately 32 million people in 2005 were served by systems for which states reported violations of these standards. A portion, but not all, of these people might have been exposed to contaminants in drinking water at levels above standards. Most of these violations involved rules addressing microbial contaminants or disinfection byproducts.
The level of health risk associated with violations varies, depending partly on which contaminants were involved, the extent to which a standard was exceeded, the extent to which the distribution system was affected, and how long the violation lasted. Microbial violations, in particular, can be short term.
The report data addresses drinking water from community water systems only. It does not address the quality of drinking water that people get from non-public supplies (such as private wells and untreated surface water sources), from public water systems serving transient populations (such as roadside rest stops and campgrounds), or from non-residential users (such as some workplaces and schools). National data are not available for bottled water, which is regulated by the Food and Drug Administration.
National indicators are not available for health effects that could be caused by contaminants in drinking water. For example, no national indicator is available for disease occurrence or outbreaks caused by harmful microorganisms in drinking water.
Wetlands
The overall extent of wetlands in the lower 48 states declined over the past 50 years. The rate of loss has slowed over time, however, and the most recent data show a net gain in wetlands acreage nationwide. Gains and losses vary significantly by wetland type.
The EPA data do not evaluate wetland quality or condition. Wetland condition is difficult to characterize fully, and there is no national indicator to measure it directly. This is partly because each wetland has unique characteristics, such as the movement and abundance of water, the minerals in the underlying soil, and the combinations of plant and animal species present.
National data do not capture locations or patterns of wetland change. Both are important for understanding condition - for example, whether large wetlands are being left intact, or are being fragmented into smaller pieces that are less connected, and therefore less able to perform their ecological functions.
Coastal Waters
Coastal benthic communities in 70 percent of the areas sampled showed little evidence of disturbance. The benthic communities in these areas showed high biological diversity and the presence of pollution-sensitive species, likely indicating that the waters were relatively unpolluted.
In the Chesapeake Bay, submerged aquatic vegetation increased from 41,000 to 78,000 acres from 1978 to 2005. However, current acreage is still less than half of the historical coverage (from the mid-1930s).
The extent of these plants is ecologically significant because the vegetation provides food and habitat for many organisms, adds oxygen to the water, filters sediments, inhibits wave action that erodes shorelines, and absorbs excess nutrients.
Elevated levels of nutrients and chlorophyll-a are present in slightly less than 10 percent of the nation’s coastal waters. However, in areas such as the Gulf of Mexico “dead zone” and Long Island Sound, substantial areas of hypoxia (when dissolved oxygen is below levels necessary to sustain most animal life) remain.
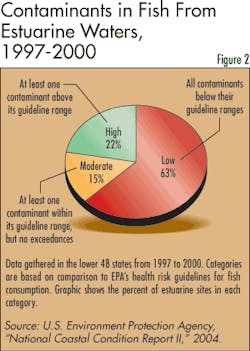
Coastal sites across the nation showed varying levels of contamination in fish tissue. Sixty-three percent of the sites showed “low” fish tissue contamination, 15 percent showed “moderate” contamination, and 22 percent had “high” contamination based on health-based consumption guidelines.
PCBs, mercury, DDT, and PAHs were most often responsible for high contamination scores. The condition of coastal fish varied significantly among different areas of the country. The survey did not include Hawaii, the Caribbean, the Pacific territories, or Alaska, which is notable because more than half the nation’s commercial fish are from Alaska.
Lake fish surveys found that several chemicals, including mercury, dioxins and furans, PCBs, and DDT, are widely distributed in the nation’s lakes and reservoirs. However, some other chemicals, including certain pesticides and PAHs, were detected rarely or not at all.
While fish consumption advisories provide information on fish from many individual water bodies, these advisories cannot be compiled into a national indicator of fish and shellfish condition. There are no consistent national indicators for disease-causing organisms in fish and shellfish, or for the biological and chemical condition of commercially farmed fish and shellfish.
Recreational Waters
While information exists about many individual water bodies, consistent national indicators for recreational waters are not yet available. Many states and localities collect information about individual water bodies in their region. States also monitor coastal beaches for levels of certain disease-causing bacteria and report the results to EPA. However, different states monitor in different ways (for example, by using different methods or monitoring more or less frequently), making it difficult to compile the results into national indicators.
Improved data collection could lead to suitable indicators in several areas. For example, with a comprehensive national system for gathering data, scientists could develop consistent national indicators for bacteria levels at beaches.


