by Yogesh K. Jitoo and Irvine Wei
Water distribution modeling is the latest technology used for evaluating existing water distribution systems and planning for future development. This tool helps to identify deficient areas in a distribution system and determine appropriate improvements necessary to make the system effective. Hydraulic modeling was used recently to evaluate the City of Medford’s water distribution system for its capability to meet current and future water demand needs.
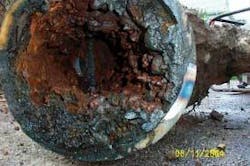
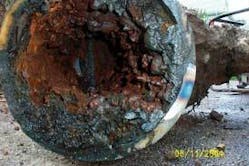
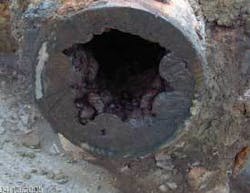
The majority of the Massachusetts city’s distribution system dates back to the 1900s and consists mostly of unlined cast iron pipe. Although the pipes have resisted corrosion sufficiently to prevent failure, their carrying capacity has been severely impacted by tuberculation. As a result, the city’s distribution system has had problems with low fire flow, rusty water at the consumer’s end and water main breaks.
The Insurance Services Office (ISO) surveyed Medford’s distribution system in 2002 and provided a list of available fire flows and required fire flows at several locations throughout the city. The list showed that Medford’s water distribution system did not meet fire flow requirements in some areas.
The city has completed major upgrades to its water distribution system by replacing and/or rehabilitating certain water mains and conducting a uni-directional water main flushing program. An up-to-date hydraulic model of the system that incorporated these improvements was needed to accurately assess the existing water distribution system.
MWH Soft’s H2OMAP Water Suite modeling software was used to assess the system. Using a calibrated hydraulic model of the water distribution system, the current available fire flows were compared to the required fire flows as determined by ISO in 2002. Further, the influence of improvements made by the city to the distribution system from 2002 through 2004 was evaluated. The model was also used to determine the adequacy of the existing distribution system for current and future water needs.
Water Distribution System
Medford’s water distribution system has been servicing the city since the 1870s and is operated and maintained by its Public Works Department. It serves a current population of approximately 55,000 and consists of about 135 miles of water mains with pipe diameters ranging from four to 16 inches.
The city’s water distribution system is composed of two major pressure zones; the low-pressure zone and high pressure zone, which is a result of non-uniform topographical areas throughout Medford. In addition, one relatively small water booster station on Doonan Street supplies water to a “super” high-pressure zone in the north high zone.
The city currently receives its entire water supply from the Massachusetts Water Resources Authority (MWRA) transmission mains.
Water System Demand
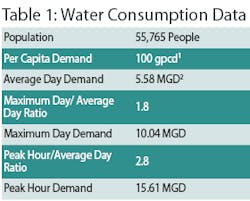
Water system demands required for the system to meet its current and future (2025) needs are as shown in Table 1. The population projections and water consumption data are as calculated by the engineering firm CDM in its September 2002 report “Water Distribution System Master Plan” for Medford. The city’s population has been decreasing steadily since 1960. For this study, the current population is considered to be same as the future population (2025).
Fire Flow Requirements
The distribution system should be capable of supplying enough water to meet the fire flow requirements. The required fire flow is the rate of water flow, at a 20 psi residual pressure and for a specific duration, that is needed to suppress a major fire in a specific location (AWWA, M31, 1998). The required fire flow rates are determined by the ISO using the Fire Suppression Rating Schedule (1980).
ISO is a non-profit association of insurance companies that compiles data that are used to establish rates for fire protection policies for both residential and commercial buildings. ISO typically estimates fire flow requirements at several locations within a community. The required fire flow is the rate of flow theoretically needed to successfully combat a major fire at a specific location. The ISO locations are selected according to their relative representation of the overall fire flow requirements of the community. Accordingly, only fire flow requirements for a small portion of the community are actually estimated by ISO. In October 2002, ISO determined that 22 of 37 locations tested in the city did not meet fire flow requirements.
System Modeling
In 2002, CDM developed a hydraulic model to evaluate Medford’s water distribution system. The city made improvements to its distribution system based on recommendations from this project, previous evaluations and according to its need. All pipes that were rehabilitated were replaced with ductile iron (DI) pipe with cement mortar lining.
In the recent modeling project, the hydraulic model used by CDM was imported in H2OMAP and upgrades to the distribution system were added to develop an up-to-date model. Upgrades were added to the previous model by changing the diameter and the roughness coefficients (C-value) of the pipes upgraded.
Hydraulic Tests, Measurements
The accuracy of a hydraulic model depends on how well it has been calibrated. Therefore, the hydraulic field data used for calibration must be accurate.
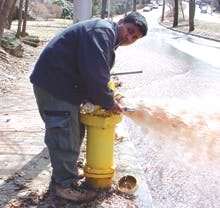
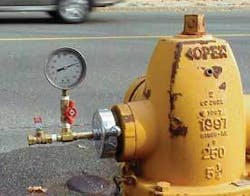
Fire Hydrant flow tests are performed in the field to obtain data on pressures for a distribution system under static conditions and stressed conditions (flowing the hydrants), and can be used in conjunction with the hydraulic model to calibrate parameters such as pipe roughness.
A total of 20 fire hydrant flow tests were performed throughout the city to obtain pressure and flow data for calibration of the hydraulic model.
Model Calibration
Calibration is the process of comparing field data to the modeling results and, if required, making changes to the parameters describing the system until the model-predicted results reasonably agree with field data under all operating conditions.
Demands were assigned to each node in the model for calibration. Average daily demand was broken down and distributed equally in gallons per minute among all the nodes in a pressure zone based upon MWRA metering information for each zone. By multiplying demands by a peaking factor or ratio, it was possible to analyze the performance of the system under existing and estimated future maximum day and peak hour demands.
A steady state simulation was performed for each of 20 fire flow test locations. The steady state simulation was done by creating scenarios for both static and residual conditions in the model for each of the 20 fire flow tests.
There were five locations where steady state simulations couldn’t be performed by changing the C-values within acceptable limits. Trying various alternatives led modelers to suspect that there were closed valves in the exiting distribution system. Medford Water Department inspected the locations and found a total of eight closed valves for the locations identified. These valves were kept closed in the model for calibration.
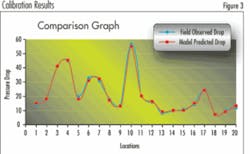
For this study, the model is considered calibrated if predicted pressure drops are within ±10 percent of the observed pressures in the field. The calibrated model results are shown in Figure 3.
Analysis Criteria
The calibrated model was further used to analyze the water distribution system. The two criteria used for analyzing the water distribution system are:
- Providing peak hour demand while maintaining a minimum pressure of 35 psi within the entire system (Peak Hour Criteria).
- Providing a maximum day demand along with any one fire flow requirement while maintaining a minimum of 20 psi within the entire system (Maximum Day Demand).
Conclusions
Analysis of the calibrated model of the City of Medford’s current water distribution system showed that the city’s recent attempt to improve its water mains to meet water demands has helped the water distribution system around the locations of the upgrades.
Although there has been some improvement, the available fire flows for 19 out of 37 locations surveyed by ISO (2002) were still unable to meet the required fire flows. Also, under peak hour criteria, some areas in the northwest and many areas in the northeast of Medford were found to be below the pressure criteria of 35 psi.
For the locations failing to satisfy the criteria, several alternative upgrade scenarios were attempted in the model to determine the most appropriate improvement for the system. The recommendations are divided in two phases. The areas of low available fire flow that require immediate attention are included in Phase I recommendations. The Phase I recommendations are prioritized to provide maximum benefit to most of the distribution system. Phase II includes recommendations in locations that would further aid in improving the distribution system to meet the fire flow requirement and peak hour demand.
There were also numerous closed/broken valves found in the distribution system during this study. The city should exercise valves in conjunction with the annual unidirectional flushing program to help eliminate closed/ broken valves.
The total cost of Phase I and Phase II recommendations is approximately $25 million. By executing Phase I and Phase II recommendations over the next 20 years, the city would be able to meet the fire flow criteria required by ISO. This would reduce the house insurance fees paid by residents, and the water distribution system would be adequate in meeting its water demands as well as its fire-fighting capacity.
About the Authors:
Yogesh K. Jitoo is an Engineer at Weston & Sampson Engineers, an engineering consulting company headquartered in Peabody, MA. He has a master’s degree in Civil Engineering from Northeastern University, Boston, and a bachelor’s degree from University of Mumbai, India. Irvine Wei is an Associate Professor in the Department of Civil & Environmental Engineering, Northeastern University, Boston. He has Ph.D. in Environmental Chemistry from Harvard University, a master’s degree in Sanitary Engineering from University of Illinois, and bachelor’s degree in Civil Engineering from National Taiwan University, Taipei, Taiwan.
