by Thomas Sigmund, Richard Onderko and John Siczka
The Milwaukee Metropolitan Sewerage District (MMSD) operates two wastewater treatment plants with a combined peak hour capacity of 630 mgd. Following major storms in the service area, wastewater flow into the system can exceed 1 billion gallons per day. Significant storage capacity within the system offsets the need to provide treatment capacity equal to the peak daily flow. MMSD’s 2020 Facilities Plan is evaluating alternatives for increasing treatment capacity during major storms.
MMSD, and its consultant CH2M HILL, conducted demonstration tests in 2005 to evaluate chemically enhanced clarification (CEC) of wet-weather flows at its two wastewater treatment plants. CEC offers the potential to treat intermittent high wet-weather flows, produce high-quality effluent, and fit into the limited space available at the Jones Island and South Shore plants. Testing was conducted during both dry-weather and wet-weather conditions. Disinfection effectiveness on CEC effluent was measured during those tests in terms of removal of E. coli, fecal coliform and male-specific coliphage (as a surrogate for human viruses). During wet-weather events, additional analysis was performed for inactivation of viruses, Cryptosporidium, and Giardia. The CEC processes provided high levels of treatment at very high surface overflow rates, minimizing their footprint to allow inclusion at either Jones Island or South Shore.
Two CEC processes were used in onsite demonstration testing: DensaDeg®, manufactured by Infilco Degremont, and ACTIFLO®, manufactured by Krüger. Since CEC effluent will require disinfection, the demonstration test program also collected information to evaluate the effectiveness of ultraviolet (UV) light on CEC effluent. Demonstration testing was conducted at South Shore from April 28 until July 6, 2005.
The CEC demonstration testing program had the following specific objectives:
- Evaluate the performance of the selected CEC technologies.
- Determine key design criteria for full-scale application of CEC and UV disinfection for wet-weather flows at the Jones Island and South Shore wastewater treatment plants.
- Conduct a general performance comparison of CEC/UV treatment to existing treatment processes.
The DensaDeg and ACTIFLO systems both employ CEC, a physical-chemical treatment process in which coagulants and flocculants are used to create conditions under which dense flocs with a high settling velocity are formed, allowing them to be removed efficiently at high surface overflow rates with corresponding high TSS and particulate BOD5 removal. The DensaDeg system attaches chemical sludge produced within it (recirculated inside the clarifier) to the incoming solids to increase density and enhance removal. The ACTIFLO system incorporates microsand in the floc to increase density of the flocs to enhance removal. A skid-mounted UV disinfection demonstration unit provided by Trojan Technologies employed the UV4000TM medium pressure, high intensity, UV disinfection technology. The lamps were equipped with an automatic chemical and mechanical cleaning system.
Considerable coagulant optimization testing was performed on primary clarifier influent. Coagulants (ferric chloride and aluminum sulfate) were evaluated at various doses to achieve the desired BOD5 and TSS removals from the CEC process (at least 50 percent removal for BOD5, 85 percent removal for TSS, and to maximize UV transmittance [UVT]). Considerable surface overflow rate testing was also performed to evaluate the reliability and robustness of the CEC units under a variety of operating conditions.
Several extended operation demonstration tests were conducted on the CEC units. Both units exhibited excellent stability and achieved 90 percent or greater TSS removal and 60 percent or greater BOD5 removal with either alum or ferric chloride. BOD5 of the CEC effluent did not meet South Shore’s effluent limits of 30 mg/L for a 30-day average or 45 mg/L for a 7-day average. Particulate BOD5 (pBOD5) removal was greater than 95 percent, soluble BOD5 removal was negligible, and the average total phosphorus in the CEC effluent ranged from 0.3 to 0.4 mg/L. UVT values were generally between 55 and 65 percent, high enough for UV disinfection of CEC effluent to be practical. During two storms, both CEC units showed excellent stability. The average TSS concentration in the CEC effluent was less than 20 mg/L and the average BOD5 concentration ranged from 40 to 80 mg/L.
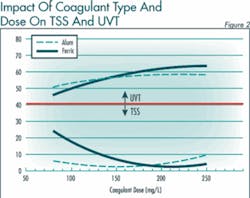
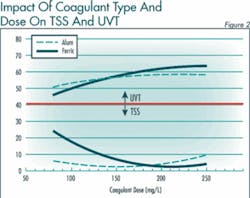
Exhibit one shows performance for CEC with respect to TSS and UVT at various coagulant dosages. The high coagulant dosages were tested on dry weather flows to determine the increase in UVT and resulting savings in sizing of UV equipment. These high dosages may reduce pH if alkalinity of wet weather flows is significantly lower than for dry weather flows. Low total suspended solids are not required for chlorine disinfection and the recommended coagulant doses can be reduced when compared to UV disinfection.
During testing at South Shore, several issues negatively affected the performance of UV disinfection including fouling of the lamp sleeves because of pickle liquor (ferrous iron) addition, ferric chloride addition in CEC units, high levels of TSS, and surface overflow rates greater than the design point.
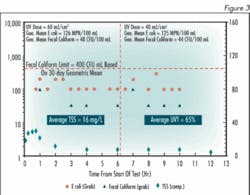
Exhibit two shows typical CEC and UV disinfection performance at selected optimized operating conditions. The detection limits for fecal coliform and E. coli were 33 CFU/100 mL and 100 MPN/100 mL, respectively.
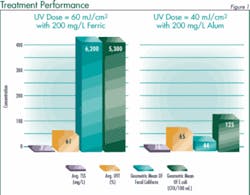
Exhibit three compares the effect of alum and ferric coagulation on downstream UV disinfection. By applying a UV dose of 40 millijoules per square centimeter (mJ/cm2) to the alum treated wastewater, the UV disinfection system achieved a 2.9-log reduction of fecal coliform and a 2.6-log reduction of E. coli. On the other hand, applying an even higher UV dose of 60 mJ/cm2 to the ferric treated wastewater only achieved a 0.40-log reduction of fecal coliform and a 0.41-log reduction of E. coli. Ferric chloride interferes with UV disinfection by absorbing UV light and creating a shadow/shield effect for bacteria and viruses attached to the ferric chloride floc.
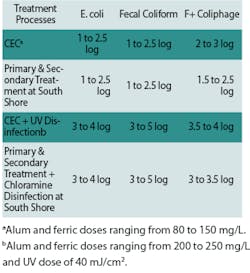
About 1 to 2.5 log10 reduction of E. coli and fecal coliform was achieved through the CEC units, which is similar to that achieved with primary and secondary treatment at South Shore. A 4 log10 reduction of E. coli and 5 log10 reduction of fecal coliform was observed after chlorine addition (chloramine disinfection) at South Shore. Similar reduction of fecal coliform and E. coli was achieved by UV disinfection of CEC effluent at a UV dose of 40 mJ/cm2, as long as the CEC process reduced TSS levels below 20 mg/L and alum was used as the coagulant.
A UV dose of at least 40 mJ/cm2 was required to reduce the fecal coliform concentration to less than 400 MPN/100 mL, the 30-day WPDES permit limit, and to achieve levels of disinfection similar to that of the chloramine disinfection system. The ACTIFLO effluent required about a 10 mJ/cm2 higher UV dose than the DensaDeg effluent in the UV dose range of 40 to 60 mJ/cm2 to achieve similar reductions of E. coli.
Exhibit four summarizes the observed log removal of the indicator organisms through the treatment processes observed in this demonstration study.
Cryptosporidium and Giardia were analyzed for in the CEC, UV, primary clarifier, secondary clarifier, and chlorine contact basin effluents but could not be reliably detected in the primary influent, making calculation of removal efficiency through CEC and primary and secondary treatment impossible. Since lower concentrations of Cryptosporidium oocysts and Giardia cysts were present in the CEC effluent than in the secondary clarifier effluent at South Shore, it can be speculated that CEC did a better job of removing those pathogens. Because there were no infective Cryptosporidium oocysts detected in any samples, it made direct comparison of chlorine to UV disinfection impossible. Because viruses were not detected in the primary influent, measurement of virus removal through CEC was also not possible. Most viruses detected during the sampling were adenoviruses; there were only four detections of enteroviruses. The virus data suggested that UV disinfection with doses of 40 mJ/cm2 results in similar virus reduction to chloramines disinfection at South Shore (1 to 3 log10), which was consistent with reports in literature.
The following findings and conclusions can be made from the results of the demonstration study:
- Both CEC units exhibited excellent stability, achieved excellent TSS removal, and good BOD5 removal (but higher than permit limits for BOD5, due to Soluble BOD5) with either alum or ferric chloride.
- UV disinfection of CEC effluent coagulated with alum was much more effective than with ferric chloride.
- Reduction of E. coli and fecal coliform through the CEC units was similar to that achieved through primary and secondary treatment at South Shore.
- Similar reduction of fecal coliform, E. coli, and F+ coliphage was achieved by UV disinfection of CEC effluent and by chlorine (chloramine) disinfection of secondary effluent at South Shore, as long as the CEC process reduced TSS levels to below 20 mg/L and the coagulant was alum.
- If chlorine disinfection is installed downstream of CEC, the recommended coagulant doses can be reduced when compared to UV disinfection. Either alum or ferric chloride will work with chlorine disinfection.
About the Authors:
Tom Sigmund, P.E., is a Vice President and John Siczka, P.E., is a Project Engineer for CH2M HILL, operating out of the firm’s Milwaukee, WI, office. Richard Onderko, P.E., is a Senior Project Manager with the Milwaukee Metropolitan Sewerage District. Onderko served as MMSD’s project manager, Sigmund served as CH2M HILL’s project manager, and Siczka served as CH2M HILL’s Project Engineer on the study of High-Rate Treatment for Wet-Weather Flows for MMSD.
