By Mary Jo Wagner
On any given rainy day in South Florida, it's guaranteed that it is raining data inside the South Florida Water Management District's (SFWMD) operation control center. And water managers here welcome the deluge.
Indeed, as soon as water drops begin to fall, the center begins receiving rainfall data every 15 minutes for more than 30,000 rain gauges across the district. And every 15 minutes, all of those precipitation values, which can swell up to 1.2 million data points, are compiled into colorful, smooth, real-time Google Earth animations, all of which can mimic rainfall for 15 minutes, one hour, six hours, an entire day or 30 days.

For the SFWMD, the animations provide a new way to look at weather systems and are a real-time moving platform to transform its water-management approach in general.
"The district has long-wanted to be able to turn their numeric tables of rainfall values into near real time animations to see rainfall for any point in the district," said Wes Hardin, a project manager in engineering company Burns & McDonnell's information management group (IMG) based in Kansas City, MO, who led the development of the animation tool.
"The customized Google Earth system provides that visualization. Now, by paralleling the storm system outside in Google Earth, water managers inside can make accurate, real-time decisions on how best to manage resources during and after storms. It's a perspective they've never had before, it's a level of information they've never had before, and it's changing the business of water management for them," Hardin said.

To create 30-day accumulation animations, such as this one, FME must start from the first 15-minute frame and then recalculate and animate the next 30-minute frame of rainfall and so on for a full 30 days.
Operational since April 2009 - just in time for the start of South Florida's rain season - SFWMD's rolling rainfall movies are providing a flood of new and detailed information. They not only show where rain is falling and how much is falling in any one location, they are helping managers better control water-flow structures, better understand stormwater runoff, better estimate water-related issues such as water depths and better predict resource overflows and their consequences downstream and upstream.
Background
Based in West Palm Beach, SFWMD covers 16 counties stretching from Orlando to the Florida Keys, including the unique and delicate Everglades freshwater wetland. The oldest and largest of the state's five water management districts, the 60-year-old SFWMD strives to maintain a delicate balance between safeguarding the water needs of the natural environment and the competing water-supply demands of nearly 7.5 million residents. The District operates and maintains approximately 2,000 miles of canals and levees, 60 pumping stations and 2,200 water control structures - all of which are the essential structural components SWFMD needs to truly remain the gatekeeper for one of the most diverse ecosystems in the world.
In parallel with amassing its critical infrastructure network to manage water flow, SWFMD has also been an avid adopter of technology and technological tools to help it effectively leverage those support systems as well as develop sustainable management strategies. A core information source has been Doppler radar to measure rainfall data in conjunction with traditional rain gauges on the ground. While a significant advancement in collecting precipitation information, the 33,774 radar values only provided a patchy report of rainfall - each gauge point represented a 4-sq-km grid - and they were presented as tabular numeric values, inhibiting managers from visualizing the rainfall across the district. That lack of a real-time, comprehensive view of rainfall not only made it difficult to react appropriately to storms, it challenged water managers to develop accurate rainfall estimates and determine how they would affect the water-control network.
With "wet" being a common backdrop in South Florida, the District needed a more timely, accurate and interactive rainfall-reporting system that would map precipitation events and allow personnel to track inclement weather, assess its effect on water resources and identify vulnerable areas that need immediate focus. Equally important was that the system be time and place specific, enabling managers to view this information for any particular location at the time of their choosing. Those compiled animations could then be used by personnel in the off season to assess the health of existing water assets, and if needed, alter their water-management strategies.
SFWMD satisfied the critical base map element by acquiring the Google Earth Enterprise platform. Managers created a customized geospatial database of canals, levees, water bodies and other features to serve as a Google Earth base map upon which they could superimpose the rainfall data. Though the core visualization tool was established, what was missing was the ability to see and track rainfall in Google Earth in real time and throughout specified time periods. To achieve this, the District needed to find a way to transform its millions of numeric rainfall values into seamless animations - a task it had unsuccessfully tried to complete once before.
First Steps
Indeed, in early 2008 SFWMD had endeavored to develop a Google Earth rainfall animation system but were challenged to find effective technological tools to animate the existing rainfall data. At issue was how the District could integrate a non-invasive technology that would allow it both to continue to collect and maintain its existing data in native formats and to transform the data into seamless visualizations in a different software platform on demand. After several attempts to reconcile that vision, the District realized that the animation bottleneck was in the data-conversion chain. Their existing tools weren't effectively transforming the rainfall values into near real-time KML files. Research into data-manipulation tools led SFWMD to spatial ETL technology, a data-interoperability tool that specializes in transforming and delivering data in user-specified formats, which seemed to offer the transformation element it needed to bring its animations to life.
To validate whether spatial ETL technology would dismantle their data-interoperability dam and provide the fluid processing chain to animate their rainfall data, SFWMD handed the Google Earth development reins to Burns & McDonnell's IMG in June 2008. Well-versed in both spatial ETL technology and Google Earth, the IMG chose Vancouver, British Columbia-based Safe Software's FME, a spatial ETL solution that enables professionals to translate, transform, integrate and distribute spatial data from more than 225 formats, for its data transformation and delivery tool.
"From our experience with FME, we knew it would not only be a critical component for converting data into the Google Earth format, it was also the only tool that we knew of that could handle the volumes of features and data involved and could process that much data into a KML format within 15 minutes," said Ryan Boyce, an information management specialist in Burns & McDonnell's IMG.
Using the system, the two-person IMG team developed a Google Earth rainfall animation application that rolls together rainfall data, watershed data and radar satellite imagery in near real-time for every corner of the district in varied timeframes.
Timing is Everything
Though Hardin and Boyce did deliver a first-of-its-kind animation system to the SFWMD, the District did not make it easy on the team. As they began to understand the intricacies of SWFMD's lofty rainfall-visualization goals, the IMG team envisioned a number of stormy challenges that they would need to weather to succeed.
The SFWMD required the IMG to convert and integrate its 33,774 ArcSDE rain gauge polygons and NOAA radar imagery into 27 different use-case animations, 22 of which needed to be updated, processed and simulated every 15 minutes. They wanted to have both incremental (15-min. views) and accumulated rainfall for every rain grid and watershed over differing time periods, including 15-minute snapshots over a six-hour window, one-hour increments over 12 and 24 hours, three-hour accumulations over three days and full 30-day accumulations. During these animations, water managers wanted to be able to stop the "movie" at any time or at any frame, zoom into any point and be able to identify the discreet rain values at each pixel. In addition, all of this new-found rainfall perspective had to be developed remotely from IMG's offices in only three months using a virtual private network.
"The data conversion and integration requirements didn't concern us because FME can convert and manipulate almost any data format," Hardin said. "The challenge was processing up to 1.2 million data points and animating them in 15 minutes - particularly the accumulation animations. Unique to the accumulated scenarios is that FME has to rebuild each dataset frame to frame, up to 24 individual frames, in near real-time. That takes a significant amount of speed and parallel-processing power to convert, integrate and to run such data-rich animations continuously."
"Compounding the development design element is that this system needed to be robust enough to serve the most number of users when it's processing the most extensive data loads," Boyce said.
Managing to Animate
However, whether they were designing the system to process the quicker radar and incremental cases or the more time-intensive accumulative cases, Hardin and Boyce had to first resolve a challenging data-management limitation of Google Earth.
"For animations, Google Earth will begin to slow down if the file sizes are too large, " Hardin said. "Our file sizes were massive - one set of their 34,000 rain gauges alone would equal up to 5 Mb per frame. Using our spatial ETL tools we could customize the KMLs to make them as small as possible, yet still maintain accurate, comprehensive and seamless animations."
That file-size restriction was exponentially more problematic for the accumulation animations because they require the system to build a visualization over time, starting from the first 15-minute frame and then recalculating and animating the next 30-minute frame of rainfall and so on for a full six hours, or 24 hours or even for 30 days.

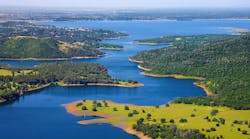
SFWMD's water managers keep a watchful eye over one of the most diverse ecosystems in the world, including the unique and delicate Everglades freshwater wetland, which extends from Lake Okeechobee on the north to Florida Bay on the south. Photo credit: Greg Davis.
The IMG team resolved this by customizing FME to continually look for similar values in each new data frame and then merge them together, reducing the number of features to animate. By dissolving the alike features, they could create smooth animations without sacrificing data integrity.
With the core animation functionality resolved, Hardin and Boyce then had to focus on another potential "flow" problem: how will the system manage relentless, real-time data updates?
SFWMD's rainfall data continuously drips in via the radar satellite data and the rain gauges - not all of which record and transmit rainfall measurements at the same time. If the District's Oracle database is being constantly populated, then the animations had to flow with the data stream as well. And that meant the system had to be data-update driven, not time driven.
To avoid overloading the application Boyce created a dedicated monitoring application to routinely check for new datasets every few minutes.
"If FME had to run 22 different use cases and check for new datasets simultaneously, it wouldn't be able to deliver all the animations in 15 minutes," Boyce said. "To ensure the Google Earth tool runs smoothly, I wrote a data-query application that uses temporary tables in Oracle and populates them with any new data. The tables have integer values that show the number of features for each particular use case. The monitoring application continuously checks those values, identifies any changes and then alerts FME to execute the particular translation."
However, with 27 different use cases to contend with, FME also needed to know which translations to run at which time. Based on SFWMD's requirements, Hardin and Boyce assigned priorities to each individual translation using the software's inherent "directives" functionality. Without the ability to prioritize translation schedules, the system would have encountered processing bottlenecks, Hardin said.
"Every use-case translation has its own priority, so when FME is ready to grab the next translation it's not necessarily the next one in line but the next one with the highest priority," he said. "The NOAA images, for example, which are updated every minute have the highest priority because they can be processed really quickly. The time-intensive, 30-day translations have the lowest. It's a very powerful and efficient data-management tool that we wouldn't have been able to easily achieve without spatial ETL technology."
Visions of Rain
Inside SFWMD's control center, all that back-end power and efficiency now culminates into bright shades of color rolling across a bank of large-screen monitors, each shade of yellow, green, red or blue revealing where precipitation is falling and how much is falling. A complete departure from their previous static, isolated views of rainfall, the Google Earth animation system is giving visual life to the District's data and drenching water managers with new levels of insight and information.
Indeed, personnel now have the dynamic analysis environment to truly dive into rainfall and make better decisions once they surface. For example, managers can animate the rainfall for any time duration of their choosing, allowing them to track when and where a storm began and how it moved through the district. That ability to "replay" rainfall events provides them with detail on storm cell movement from north-south and east-west that they have not previously been able to ascertain.
With such an animated and detailed rainfall-reporting system, water managers have the opportunity to better understand the relationship between precipitation and stormwater runoff as well - particularly because they can study accumulation animations. Whether they prefer a six-hour window or a 3-day period, managers can assess the total accumulation for that particular duration, and then coupled with supplementary information sources, they can improve their ability to estimate the amount of stormwater runoff produced by a specific rainfall event in a specific location over a specific length of time.
About the Author:Mary Jo Wagner is a freelance writer, editor and media consultant based in Vancouver, BC.
More WaterWorld Current Issue Articles
More WaterWorld Archives Issue Articles