Increasing Focus on Water Loss Control: More States Requiring Utilities to Conduct Water Audits
By James Laughlin, WaterWorld Editor
Water loss is an issue at drinking water utilities across North America and throughout the world. A number of states are requiring utilities to conduct water audits to gauge how much water is lost without producing income for the utility. In many cases they are requiring utilities to use a standardized methodology that takes into account both the financial impact of the water loss and validity of the data on which the audit is based.
While the old standard for water audits looked simply at the percentage of unaccounted for water compared to the amount of water produced, the newer Water Audit Methodology developed by the American Water Works Association and International Water Association looks at non-revenue water as a percent of system operation costs. It also includes a feature to grade the quality of the data used to complete the audit. Users are asked to assign a value to the data ranging from rough estimates to highly reliable. A composite score is generated to provide a "Validity" value.
"With the old methodology a lot of utilities would be reported for non-compliance that were actually good performers. The new methodology can give us performance indicators that are accepted throughout North America and are a more standardized methodology," said Chris Leauber, Executive Director, Water & Wastewater Authority of Wilson County, Tenn. Leauber serves on the AWWA Water Loss Control Committee and gave a paper focused on water auditing at the Distribution System Symposium earlier this year.
The state of Tennessee has been requiring water audits since 2007. While utilities were allowed to use the older water auditing practice initially, starting in January 2013 the AWWA methodology will be required.
Leauber said Tennessee's adoption of water audits was driven by an angry customer who had the ear of a state legislator. While investigating a rate increase proposed by his local utility, the customer discovered the utility was billing for less than 50 percent of the water it produced.
"He contacted his local legislator who introduced legislation in Tennessee and we had a law on the books a few months later," Leauber said.
Tennessee joins a diverse range of states that require utilities to audit their water systems. Texas was an early adopter, requiring public utilities to conduct audits every five years. The last was completed in 2011 with the next audit due by May 2016.
During the first round of auditing, some 2000 utilities reported water loss ranging from 5.6 to 12.3 percent of all water entering the reporting systems. When extrapolated to all retail public utilities in Texas, the statewide value of total water loss was estimated to be between $152 million and $513 million per year, according to a report published in 2007.
In Georgia, utilities that serve more than 10,000 customers were required to conduct water audits this year, in part because of an ongoing battle over usage of water from Lake Lanier. That reporting requirement will be expanded to include public water systems serving more than 3,300 individuals next year. Georgia's Water Stewardship Act of 2010 also requires utilities serving 3,300 or more people to implement water loss detection programs.
The California Urban Water Conservation Council (CUWCC) has one of the most ambitious water loss control programs in the country. Its members are tasked with performing annual water audits. Since the program began in 2009, signatory utilities have focused on improving their water audit data, with a goal of attaining a high level of data validity. Beginning in 2014, the focus will shift to quantifying specific leakage amounts, and setting and attaining meaningful leakage control goals.
Auditing Methodology
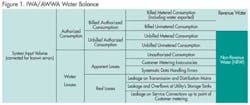
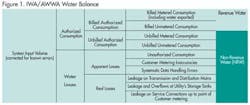
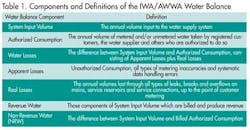
There are two major components in water loss. One is apparent water losses, which are the non-physical losses. A big component of apparent losses would be inaccurate metering, but also could include unauthorized consumption and data handling errors. Apparent water loss is valued at the retail rate.
The other component is real water losses, with leakage as the major cause. That loss is valued at the cost to produce the water, which can include power and chemical costs. For smaller utilities that purchase water, it's the cost they pay suppliers plus the cost of distribution. Generally speaking, leakage represents a much larger quantity of water loss than the apparent losses.
In addition to water loss, there are several categories of "non-revenue" water that may be metered or unmetered.
The AWWA/IWA Water Audit Software, available for free download from the AWWA website, includes a series of worksheets that step the user through the auditing process. The majority of data is entered in the Reporting Worksheet, which prompts the user to enter standard water supply information such as the volume of water supplied, customer consumption, distribution system attributes and quantities of losses.
According to the AWWA website, the most important new functionality upgrade in Version 4.2 of the Water Audit software, released in 2010, is the ability to grade the quality of the data. Each of the data inputs on the reporting worksheet are assigned a grading value ranging from 1 to 10. A grade of 10 represents highly reliable, well validated data, while a grade of 1 reflects rough estimates.
Once all the grading cells have been entered, a composite grading score is generated on a scale of 100. Utilities with a lower composite score should focus on data collection and validation to improve the quality and reliability of their data. Utilities with a higher composite score can trust their data when making budgetary decisions or planning water loss control programs.
In the case of Tennessee, utilities that have a validity score of 65 or less in their 2013 report can be referred to their regulatory board for review. They also face review if the amount of non-revenue water as a percent by cost of operation is 30 percent or greater. The required validity score goes up to 70 percent in 2015 and tops out at 80 percent in 2019. At the same time, acceptable amounts of non-revenue water drops to 25 percent in 2015 and must be reduced below 20 percent by 2019.
Loss vs Repair
In Tennessee, water audit reports are submitted to the Comptroller of the Treasury's Water & Wastewater Financing Board, the same agency to which utilities send their audited financial statements each year. The board is responsible for determining the financial, technical and managerial capacity of water systems and looks at the value of water lost and its impact on the water utility's profitability and sustainability.
Losing some water out of a distribution system that can cover hundreds of miles is a given. There will always be some water lost through leakage, theft or inaccurate meters. The goal is to reduce the amount of loss in a manner that takes into consideration economics, sustainability and the needs of the community.
The Water Research Foundation has a research project underway to build a simplified model that utilities can use to examine the value of their leakage versus the cost of intervention using all currently available methodologies for finding underground leakage, Leauber said.
The cost of repairing leakage adds up. "When you intervene you reduce the amount of loss in your system and the amount of water loss goes down, but the cost of the intervention goes up," he said. The new model, which should be available in about two years, will help utilities demonstrate the economic level of leakage.
"What you don't want to happen is for a regulator to say you need to reach a certain target, but in order to reach that target you would have to invest more money than it would be worth. That would trigger rate increases to the customers because you are reaching a target beyond the economic level of leakage," Leauber said.
Conclusion
The goal of water auditing programs is to focus attention on the problem of water loss. While most water utility managers may know they have a problem, controlling the issue is not a top priority for some.
"There are more utilities that are not proactive in water loss control than are proactive," Leauber said. "As long as their customers have pressure and the tanks are staying full, water loss is out of sight, out of mind.
"In conversations with utilities, you will hear things like ‘We just completed the AWWA methodology because we were out of compliance and we started going out and sounding our system for leaks and found a service line leak that's been running for 35 years,'" Leauber said. "And that's the thing. It isn't about the regulatory targets they have to meet. It's about following the methodology and becoming aware that water loss is an issue in their system."
Information on the IWA/AWWA Water Audit Method and a link to download the auditing software can be found here: http://www.awwa.org/Resources/WaterLossControl.cfm?ItemNumber=48055.WW


