Nitrate levels continue to increase in Mississippi River, finds study
Oct. 31, 2013 -- According to a new U.S. Geological Survey (USGS) study, the Illinois River has seen a significant decrease in nitrate levels in recent years, but other sites throughout the basin are experiencing an increase in levels of the chemical compound.
The study indicated that nitrate levels in the Illinois River decreased by 21 percent between 2000 and 2010, marking the first time that substantial, multi-year decreases in nitrate have been observed in the Mississippi River Basin since 1980. However, "nitrate levels continue to increase in the Missouri and Mississippi Rivers, including the Mississippi's outlet to the Gulf of Mexico," said Lori Sprague, USGS research hydrologist.
Excessive nitrate and other nutrients from the Mississippi River strongly influence the extent and severity of the hypoxic zone that forms in the northern Gulf of Mexico every summer. This hypoxic zone, known as the "dead zone," is characterized by extremely low oxygen levels in bottom or near-bottom waters, degraded water quality and impaired marine life. The 2013 Gulf hypoxic zone encompassed 5,840 square miles -- an area the size of Connecticut.
"These results show that solving the problem of the dead zone will not be easy or quick. We will need to work together with our federal and state partners to develop strategies to address nitrate concentrations in both groundwater and surface water," said Lori Caramanian, Department of the Interior deputy assistant secretary for water and science.
The reasons for increases or declines in annual nitrate levels are unknown. Reliable information on trends in contributing factors, such as fertilizer use, livestock waste, agricultural management practices, and wastewater treatment improvements, is needed to better understand what is causing increases or decreases in nitrate.
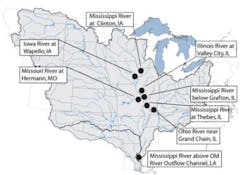
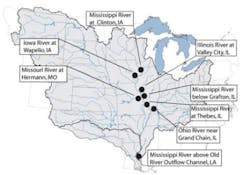
Nitrate trends from 1980 to 2010 were determined at eight long-term USGS monitoring sites in the Mississippi River Basin, including four major tributaries (Iowa, Illinois, Ohio, and Missouri rivers) and four locations along the Mississippi River using methodology that adjusts for year-to-year variability in streamflow conditions.
Nitrate increased at low streamflows throughout the basin, except for the Ohio and Illinois Rivers. Groundwater is likely the dominant source of nitrate during low flows. It may take decades for nitrate to move from the land where it was applied, migrate through groundwater and eventually flow into these rivers. Because of this lag time, it can take several years or decades before the full water-quality effects of either increased groundwater contamination, or of improved management practices, are evident in the rivers.
The USGS report and additional information on nitrate trends in concentration and flux for each of the eight sites are available online. Additional information on USGS long-term monitoring sites in the Mississippi River Basin is also available online (PDF).
###

