Situations Define “How Is Water Quality Measured?”
In this concluding segment to the Water Quality Index, author Harbans Lal illustrates situations and calculates solutions for the parameters and modelling of the Water Quality Index (introduced in Part 2 of this series). Upon reviewing these scenario-based applications and corresponding WQI calculations, water quality experts can establish water quality benchmarks, make sound recommendations, and can concretely answer “How is water quality measured?”
Introduction to the Water Quality Index (Part 3, Conclusion) By Harbans Lal
Expressing water quality information in a format that is simple and easily understood by common people
In this concluding segment to the Water Quality Index, author Harbans Lal illustrates situations and calculates solutions for the parameters and modelling of the Water Quality Index (introduced in Part 2 of this series). Upon reviewing these scenario-based applications and corresponding WQI calculations, water quality experts can establish water quality benchmarks, make sound recommendations, and can concretely answer “How is water quality measured?”Introduction to the Water Quality Index (Part 3, Conclusion) By Harbans Lal
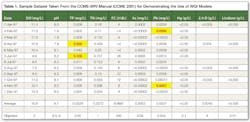
Expressing water quality information in a format that is simple and easily understood by common people [text_ad] Examples of WQI Calculation The CCME Water Quality Index User’s Manual (CCME 2001) presents a dataset for demonstrating their procedure. We used their dataset (Table 1) for demonstrating WQI calculation procedures of different models. The CCME dataset contains observations on 10 parameters for the North Saskatchewan River at Devon, Alberta, in Canada, for the period of one year (1997). Most variables were sampled on monthly basis with one missing observation for mercury, and quarterly observations for pesticide (2,4-D and Lindane). The parameters included are: dissolved oxygen (DO), pH, total phosphorus (TP), total nitrogen (TN), fecal coliform (FC) bacteria, arsenic (As), lead (Pb), mercury (Hg), 2-4-D, and lindane.- very poor for WQI less than 60
- poor for WQI between 60–70
- fair for WQI between 80–84
- good for WQI between 85–89
- excellent for WQI between 90–100
Examples of WQI Calculation
The CCME Water Quality Index User’s Manual (CCME 2001) presents a dataset for demonstrating their procedure. We used their dataset (Table 1) for demonstrating WQI calculation procedures of different models. The CCME dataset contains observations on 10 parameters for the North Saskatchewan River at Devon, Alberta, in Canada, for the period of one year (1997). Most variables were sampled on monthly basis with one missing observation for mercury, and quarterly observations for pesticide (2,4-D and Lindane). The parameters included are: dissolved oxygen (DO), pH, total phosphorus (TP), total nitrogen (TN), fecal coliform (FC) bacteria, arsenic (As), lead (Pb), mercury (Hg), 2-4-D, and lindane.
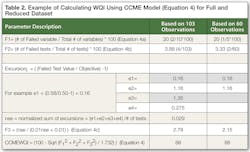
Table 2 presents the CCME-WQI calculation for two scenarios. The first scenario deals with the complete dataset of 103 observations presented in the CCME-WQI manual (CCME 2001). It is the exact reproduction of the example in the CCME manual. The second scenario is with the reduced dataset of 60 observations for five parameters (DO, pH, TP, TN, and FC). They were selected to demonstrate WQI calculation with other models such as OR-DEQ model. We used the subjective rating curves and sub-index algorithms from Cude 2001 to analyze annual averages of the five parameters for calculating WQI using other models.
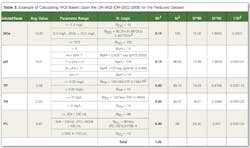
Table 3 presents annual averages, ranges, SI-logic (algorithms), and calculated sub-index for each of the five parameters of the reduced dataset. This table also presents the calculated values of SI*Wi, SI^Wi, and 1/SI2 for the three WQI models: 1) weighted arithmetic mean (Equation 1), (2) weighted geometric mean (Equation 2), and (3) un-weighted harmonic square mean (Equation 3). Table 4 shows the WQIs and their qualitative ratings (Excellent, Good, Poor, etc.) based on different models. All these values were calculated using the reduced dataset expect for the CCME-WQI, which was calculated both for the complete and reduced dataset.
The WQI using CCME approach remains almost same (88) both for the complete and reduced datasets—classifying the water as “Good.” On the other hand, the WQIs based on the Oregon DEQ models for the three equations are around 95, thus classifying the water as “Excellent.” It implies that the OR-DEQ model is more liberal than the CCME model. However, it is not the intent of this exercise to evaluate different models, but rather to demonstrate the procedure for calculating WQI using different models.
Interpreting WQI and Its Advantages and Limitations
The WQI synthesizes complex reality of multiple water quality parameters into a single value that can be appreciated and understood by common man. The single WQI number ranges between zero and 100. It expresses water quality where a higher number indicates better water quality. For example, Oregon DEQ models (Cude 2001) score water as:
- very poor for WQI less than 60
- poor for WQI between 60–70
- fair for WQI between 80–84
- good for WQI between 85–89
- excellent for WQI between 90–100
These indices are considered trustful. However, the possibility of some parameters having disproportionate influence on the final results producing a biased index always exists. Thus, a thorough review and considerations to the weighing factor for each parameter should be discussed and well documented with experts and stakeholders of the water resource. The WQI aids in assessing water quality for general purpose. To determine the suitability of the water body for a specific usage, it should be combined with other appropriate information.
WQI for the Agricultural Field Use
Within the US Farm Bill provision, the USDA/NRCS provides technical assistance and financial assistance (cost share) that enable agricultural producers to be good stewards of the Nation’s soil, water, and related natural resources on non-federal lands. One of the key goals of implementing conservation practices is to maintain and improve water quality within the watershed.
The NRCS is always looking for approaches and techniques to evaluate the effects of its programs on the environment including water quality. The Conservation Effects Assessment Project (CEAP) is an example of such as program (USDA/NRCS 2011). The WQI could serve as a simple first-step tool for such an evaluation process for improving and/or sustaining the quality of water in the watershed. However, the structure and components of the WQI models discussed in this paper would need to be modified for it to be appropriate for the runoff from agricultural fields. Efforts are underway by the National Water Quality and Quantity Team of the NRCS/USDA to develop such a WQI model—referred to as WQIag.
Concluding Remarks
Similar to other indices such as Dow Jones Industrial Index, the WQI takes information from a number of sources and combines them into a single number that represents an overall snapshot of the quality of the water at a particular time and location. There is some debate as to which parameters (measures) should be included in the derivation of such an index; however there is general agreement that WQI is a useful tool for comparing water quality across water systems and over time. It can also answer to questions such as: “Can I eat the fish, drink the water, or swim in it without fear?”, in common man terms. The simplicity of WQI in expressing the water quality would be much more appreciated by farmers, the common public, and the policy makers. The WQIag, when developed, could serve as a benchmark for evaluating success and failures of management strategies, and help answer questions such as how effective a conservation practice has been in improving the water quality in the watershed. It could even inspire farmers to serve as better stewards of the conservation practices because they can easily understand its impacts.


