Non-Revenue Water Loss: Its Causes and Cures

“Imagine that you run a company that sells bottled water. You spend lots of money, and use lots of energy, pumping the water out of the ground, purifying it and transporting it for sale. Then, one day, you discover that a large number of bottles never make it to the stores. They are falling through holes in the trucks. Wouldn’t you want to know what could be done about it? Wouldn’t you be crazy to allow the situation to continue?”
–David Bornstein, “The Art of Water Recovery,” The New York Times, July 10, 2014.
In this day and age of widespread, long-term droughts, impacts from climate change, and rapidly increasing rates of urbanization as cities around the world explode in size and number, water loss is a critical issue. Some cities have experienced water losses as high as 70%. But even small losses that accumulate over time can have significant financial impacts on community water departments and economic impacts on water customers. The question then becomes, who picks up the tab? Who actually pays for these losses, how are these water costs covered in current budgets, and how do communities afford the necessary improvements needed to minimize water losses?
WHAT IS NON-REVENUE WATER LOSS?
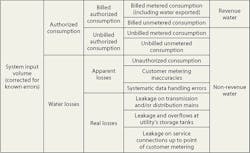
Simply put, non-revenue water loss is water that does not make it from point A (the source of the water distribution system) to point B (the end user) because it got lost along the way due to leakage, wastage, or theft. These losses can be real, physical losses (caused by leaks, breaks, spills, etc.) or only apparent losses that occur as a result of broken or tampered meters, poor meter reading, inaccurate record keeping, or outright water theft. Even relatively small amounts of water loss can add up over time to represent a significant financial drain on the water utility (due to lost revenue from customers). The leaks and breaks that allow water to escape can also allow impurities to enter the distribution system, impairing the quality of the water itself.
Total non-revenue water loss is measured by the volume of the water lost (in liters or gallons) as a percentage or share of the total water supplied during the same time period. The rate of water loss can also be expressed as the volume of lost water per length (measured as kilometers or miles) of the pipes making up the water distribution system. These numbers will vary according to location and age of the water supply system. Developing nations face a serious problem with water losses for their rapidly expanding urban areas. But developed nations also face significant issues resulting from old and underfunded water infrastructure. In both cases, significant cost savings and efficiencies are possible, provided the money and will are available.
A distinction should be made between non-revenue water loss and unaccounted for water. The terms are sometimes used interchangeably, but are actually quite different. Non-revenue water includes authorized but unbilled water use (such as for firefighting) while unaccounted for water does not.
A BRIEF DESCRIPTION OF WATER DISTRIBUTION SYSTEMS
Water is delivered from source to customer by means of a water distribution system. This system consists of multiple components. The first component is the source of the water. This can be groundwater extracted by a system of extraction wells, a natural surface body of water such as a freshwater pond or lake, or a man-made reservoir created
by dams or other earthworks. The second component is a series of physical structures and/or mechanical equipment to extract water from its source and transport it to a treatment plant. These include groundwater wells, aqueducts, pump stations, and water pipelines. The treatment plant is the third component of the system. At the plant, the water is treated to remove impurities (microbes, debris, soil particles, etc.) so the water can become potable and fit for human consumption. The last component is a storage structure to hold excess water and even out overall flow rates throughout the variable daily use cycle.
Being usually buried underground, water supply pipes are not normally noticed unless they fail or break. Water customers take this piping system for granted, not knowing how much engineering, maintenance, and repair is required to keep them operating properly. So how do water pipes fail? In general, the main threat to pipe integrity is physical deterioration. Due to long-term effects such as rust, corrosion, electrochemical reactions, or biological fouling in adjacent soil and groundwater, the physical structure of the pipe walls can be weakened and thinned.
The fittings, fixtures, and appurtenances that connect and redirect a distribution system’s pipe segments are all potential weak points. Therefore, any bends, valves, tees, wyes, or flanges are possible points of failure since these connections are always less strong than the pipe itself. Resultant dead loads include vibration from equipment and vehicles, thrust movement created by the force of water being carried by the pipe (hence the need for thrust blocks to brace the pipe), exterior pressure from soil both in the backfill adjacent to the pipe, and natural soil adjacent to the pipe’s trench, simple settlement or shifting of soil, and the force of expansion of frozen water inside the pipe.
Pipe materials vary considerably and each has its own strength characteristics and potential for failure. Today, most new water pipelines and fittings are constructed with vinyl plastics (usually PVC), metal (from copper feeder lines servicing individual users to old-fashioned cast iron, more flexible ductile iron, and even stainless steel), asbestos cement, and reinforced concrete. Water pipe diameters vary considerably from 6 inches to 16 inches, with 8 inches being the most common. Branch service lines to individual homes and businesses also vary from 0.5–6 inches (with larger lines for major commercial or industrial operations). Pipe strength derives from both its inherent material qualities and the thickness of the pipe walls. Together, these characteristics determine a pipe’s structural integrity and its resistance to long-term degradation.
The popularity of PVC pipes for new water pipelines illustrates this last point. PVC is both durable and cost-effective, as well as flexible in response to applied loads and resistant to chemical corrosion. These attributes make it less vulnerable to breaking or cracking and ensures long-term durability. As a result it needs less maintenance effort or repair costs.
PVC is not the only pipe used in modern water distribution systems. Other types of pipe—used in new installations—can be found in older sections of a water distribution system. Not counting the lead pipes used by the ancient Romans, cast iron pipe is often what is found in the oldest and original parts of a water system. Not much used after the mid-1970s, cast iron was cheap to produce but also brittle and vulnerable to cracking and rust.
Ductile iron—more flexible and stronger than cast iron—is the pipe material most often found in older parts of a water distribution system. Cast iron pipe has largely been replaced as a result of failure and breakage over the years. To minimize its vulnerability to rust and corrosion, the interior walls of ductile iron pipe are usually coated with a protective material such as a thin layer of cement mortar. Though stronger and more durable than ductile iron pipe, steel pipe is more expensive. Its pipe segments can be welded together to form continuous pipe sections without potentially weak joints, but since it has a higher coefficient of thermal expansion than iron, steel is vulnerable to distortions caused by temperature-induced expansions and contractions. Rounding out the types of pipes used to deliverwater are asbestos cement (largely discontinued due to health concerns), reinforced concrete (usually reserved for very large water mains in major urban areas), and the small-diameter Type K copper pipeline used to deliver water to individual homes.
WHERE AND WHY DOES NON-REVENUE WATER LOSS OCCUR?
The above description of a secure and up-to-date water distribution system would seem to leave no path for significant water losses. Yet studies of water distribution systems in both developing and developed nations show significant potential for water losses both real and apparent. Real losses are obvious, caused by leaks and breaks in transmission mains, storage tanks, cisterns, distribution pipelines, and individual service connections. Apparent losses occur from deliberate theft of water from a supply system (either via illegal taps or by the tampering of water meters to read lower flows than what is actually being used) or unbilled water consumption that is authorized but not properly read or recorded by the utility.
The very nature of water loss makes it difficult to impossible to find or determine the specific locations and causes of the loss. Water utilities are essentially hidden. Like icebergs, the vast majority of their structure is below the surface where it can’t be readily seen or easily measured. So it becomes extremely difficult for a utility to pinpoint causes, break down what percentage of water loss is due to which cause, and assign preventative measures. Repair efforts are usually only delegated to the most obvious sources of water loss, like significant water main breaks.
The first step in isolating the problem is to bracket the potential sources by mapping the meter readings and pressure gauges at key points and distribution nodes throughout the water supply system. Comparing this data with what should be the theoretical water use (based on engineering studies) can help a utility identify at least the parts of the water supply system that are having problems. Armed with these estimates, a utility can then attempt to remedy the situation.
Not every non-revenue water loss is physical; some loss is the result of cheating. This is a practice as old as civilization. Citizens of ancient Rome were in the habit of illegally tapping into the aqueducts providing water to the imperial capital, a practice many emperors tried and failed to stop. Today, given the greater sophistication of monitors, meters, and sensors available to water utilities in developed countries, apparent losses are minimized and most of the non-revenue water loss in these nations is due to physical leaks and breaks. Developing countries, on the other hand, can experience losses due to theft and illegal connections that account for 40% of non-revenue water loss. In major cities these apparent losses can be greater than real losses.
These types of water loss can be categorized by the water balance table below:
HOW BIG IS THE PROBLEM?
In developed countries, water losses are primarily the result of aged infrastructure. EPA indicates that public water systems experience non-revenue water loss rates on an average of about 16%. Their hopeful observation is that nearly 75% of this loss is potentially recoverable. But when it comes to estimating water losses, everything is at best a “guess-timate” since few of America’s 55,000 public water supply systems and 21,400 nonprofit, non-community water systems perform water audits that meet the standards established by the American Water Works Association (AWWA). And this knowledge is critical given the aging of our infrastructure and long-term drought conditions (such as in California) afflicting large parts of the country.
Many of our major cities, especially on the East Coast, still use water infrastructure elements that pre-date the Civil War. EPA estimated in 2013 that drinking water infrastructure will require an investment of at least $384 billion dollars through 2030 to modernize the system and ensure that it continues to provide safe drinking water. In addition to preserving public health, these investments have additional benefits. According to the US Congress of Mayors, every $1 invested in water supply and sewer projects adds almost $9 to the national economy (2008). Over the next decade, 30 of the nation’s largest water and wastewater utilities plan on investing $230 billion, resulting in $524 billion in direct economic output, and 289,000 jobs annually. And America simply does not have a choice. These investments have to be made. The alternative is an inadequate and contaminated water supply, a health threat, and quality-of-life crisis beyond imagining.
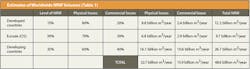
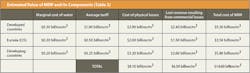
Internationally, the problem is far worse. According to World Bank data, world water supply may fall 40% short of global demand, with water systems in developing nations suffering non-revenue water loss rates of at least 35%, and some systems experiencing losses higher than 50%. Furthermore, the World Bank estimates that water supply systems worldwide have real water losses—due to leakage and breakage—of 8.6 trillion gallons per year: “The result is quite staggering. Every year, more than 32 billion cubic meters of treated water physically leak from urban water supply systems around the world, while16 billion cubic meters are delivered to customers for zero revenue. Half of these losses are in developing countries, where public utilities are starving for additional revenues to finance expansion of services and where most connected customers suffer from intermittent supply and poor water quality” (“The Challenge of Reducing Non-Revenue Water in Developing Countries,” The World Bank, dated December 2006). Their estimates of water losses and their causes are shown on Table 1 (above). For comparison, America as a whole utilizesapproximately 1,053 billion cubic meters of water each year. These staggering levels of water loss translate into equally staggering financial losses, shown on Table 2 (below).
DETECTING AND ESTIMATING NON-REVENUE WATER LOSS
No one can fix a problem if they don’t know that it exists, so the first step is to perform a water audit. Without a thorough and accurate water audit, a utility can’t assess the scope or determine the nature of its non-revenue water loss problem. A well-performed audit can be the best investment a water supply utility can make. It is a key tool in developing a plan to minimize and reduce non-revenue water losses.
Water audits can be validated or unvalidated. Unvalidated audits are purely pencil and paper exercises—desktop studies that include estimates. Their error range may be as great as plus or minus 50%. However, they can be a necessary first step in the auditing process since this initial estimate can help identify where a more focused study will be necessary. It is best to think of an unvalidated audit as a screening process, reducing the potential areas where loss could be occurring and allowing for a more cost-effective second step.
This second step is the validated water audit. This is a more complicated undertaking and involves thorough sampling and testing of water meters, elimination of billing errors, and mapping all known illegal connections through field surveys and aerial mapping. The AWWA has developed software for performing water audits. The software includes analytical tools that allow a utility to rate the overall validity and accuracy of their water audit data.
Accurate analysis includes the proper means of measuring non-revenue water loss. It has been found that monitoring changes in water losses over time or benchmarking them between utilities is not an appropriate measurement. Absolute water loss quantities can vary considerably over time relative to total water consumption. A proper measurement of water loss is quantifying the amount of water wasted in terms of absolute losses per connection per day. This takes greater time and budget to quantify since so many utilities rely on a measurement based on percentage of total consumption. So of the three main methods of evaluating water loss (water loss as a percentage of total consumption, water loss per connection, and water loss per length of pipe network), the second is useful for estimating apparent losses while the last is useful for calculating real losses.
However, some water loss is unavoidable since the actual amount of real losses depends on factors that can’t be easily corrected by the water supplier such as topography, age of the water distribution system components, length of the network piping, number of connections, and per capita water consumption. An overall Infrastructure Leakage Index (ILI) has been developed to evaluate water audit data. ILI has been defined as the ration of Current Annual Real Losses (CARL) to Unavoidable Annual Real Losses (UARL). Theoretically, a very well-managed water system could have an ILI of 1.0 (CARL = UARL). But practically speaking, this index assumes that there is a certain minimum amount of water loss that occurs in any system and that this amount for a particular water system can be estimated using the factors described above. Any amount of water loss above this minimum is therefore due to factors that can be discovered and corrected.
REMEDIES AND PREVENTATIVE MAINTENANCE
Now that water losses have been estimated and their sources located, what is the next step? Armed with data from the water audit, a utility can establish non-revenue water zones with the highest recorded or estimated water loss rates. The utility can then directly track water usage and loss in these areas by installing additional meters. Using information from these meters, the utility can then perform component-based leakage modeling to pinpoint possible loss locations. This will allow for easier discovery and subsequent repair and replacement of leaking service connections. Follow-up efforts would include continued monitoring and proper pressure management of the system to minimize unavoidable leakage as much as possible.
In general, management and minimization of non-revenue water loss is based on four principles: active leakage control, pressure management, infrastructure management, and speed of repair. Each has its strengths and limitations.
Active leakage control is a water utility’s first line of defense. It can be cost-effective to hunt down and repair leaks on water mains and primary distribution pipes. However, once the more obvious leaks, breaks, and failures have been located, such a direct effort gets harder and harder to accomplish.
Pressure management involves in installation of pressure-reducing valves (PRV) at key locations in the water distribution system that could be subject to excessive applied pressure and therefore subject to potentially higher levels of leakage. However, using too many PRVs (along with associated meters and possibly new pipe segments) can become costly compared to the cost of the water saved.
Infrastructure management (such as the replacement of water mains, pump stations, storage facilities, etc.) is most cost-effective if carried out in accordance with targeting studies and water audits, which can determine and even predict the parts of the water system most prone to breaks and leaks. However, after the initial evaluation of “low-hanging fruit” within the system, this effort becomes more difficult to perform in a cost-effective manner.
Speed of repair is also crucial to managing water losses. Obviously, the less time a broken pipe has to leak, the less water will be lost. But after a certain threshold of reduced repair time is achieved, more extensive efforts cannot be justified in terms of the cost of the water saved. Utilities simply cannot afford to add more manpower and equipment to perform repair tasks.
THE FINANCIAL IMPLICATIONS OF MANAGING NON-REVENUE WATER LOSS—IS IT WORTH THE PRICE?
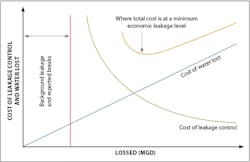
The bottom line, however, is that there can never be a perfect water distribution system with 0% non-revenue water loss. There comes a point of diminishing returns when it comes to reducing these losses. The key term here is the economic level of leakage (ELL). ELL is defined by the International Water Association as “the level of leakage where the marginal cost of active leakage control equals the marginal cost of the leaking water” and as the “economic level of real losses [that] occurs when the sum of the value of the water lost through real losses and the cost of activities undertaken to minimize real losses is at the minimum.”
An example of the relationship between ELL and the cost of ongoing water loss is shown in the above graph.
The utility managers need to keep in mind that ELL can change over time. These changes can result from continued aging of infrastructure, improvements, and expansions; other changes to the distribution system; and seasonal changes in temperature and weather.These potential improvements to the system could include additional metering, pressure controls, improved pipe materials, and telemetry applications. The cost of water can also change over time due to changes in demand. Increases in the size of a city’s population could make the cost of water more valuable per gallon thus increasing the value of ELL. The operator also needs to remember how different measuring techniques and evaluation metrics can alter the projected value of the ELL. And new technology can always appear to lower the cost of leakage control, reducing the cost of ELL.