Water-Quality Monitoring Delivers Answers—and New Questions
Aside from a few landlocked lakes and alluvial fans that dot the planet, all stormwater gravitates toward the ocean, and it is at the ocean’s edge that stormwater quality degradation delivers some of its most unpleasant and most visible outcomes. Nutrient pollution threatens coastal ecosystems with eutrophication; fecal contamination from stormwater outfalls drives vacationers from beaches; and contaminants carried from roads, industrial sites, and altered landscapes exert disproportionate influence on aquatic habitats for untold numbers of species, including humans. What starts far upstream can have notable effects far from the source. Stormwater monitoring programs can help communities and scientists understand where pollution risks occur and help professionals devise strategies to reduce these risks.
The Susquehanna is an important river on the East Coast that, from its headwaters near Cooperstown, NY, covers 444 miles on its way to the ocean. Along with its hundreds of tributaries, it drains 27,510 square miles of territory, an area nearly the size of South Carolina, spread over parts of the states of New York, Pennsylvania, and Maryland. The river eventually drains into the Chesapeake Bay, the largest estuary on the US Eastern seaboard, which serves as home to major shellfish fisheries and as a nursery and spawning grounds for numerous seagoing species. The picturesque upper reaches of the Susquehanna, however, have recently become embroiled in a simmering debate.
Beneath the Susquehanna River basin, geologists have discovered what is potentially the largest natural gas reserve in the United States. Locked within the porous rock formations of the Marcellus Shale and the Utica Shale, an enormous reserve of gas—measuring, according to estimates from Chesapeake Energy, up to 363 trillion cubic feet—lies waiting to be exploited. According to the US Geological Survey (USGS), the Marcellus gas resource may be large enough to supply the needs of the entire United States for roughly 15 years at the current rates of consumption.
Monitoring in the Susquehanna River basin
To access this energy resource, drilling companies have employed the technology of hydraulic fracturing (fracking), a practice whereby a mixture of chemicals, fluids, sand, and water under high pressure is pumped into the gas-bearing rock deep below ground. This process fills the voids in the rock with the fluids and generates fissures through which gas can eventually be forced to the surface, where it can be collected for delivery to market.
Communities neighboring hydraulic fracturing sites have raised concern about possible detrimental environmental effects of this process, should materials, debris, or constituents of fluids used in the process, or residues from other aspects of drilling operations, escape into the wider environment.
Facing the prospect and practice of hydraulic fracture gas extraction taking place in various parts of the Susquehanna basin, the surrounding communities became concerned about its potential effects on their local water bodies. Dawn Hintz, an environmental scientist with the Susquehanna River Basin Commission (SRBC), says “People wanted to know if there was something wrong.”
The SRBC is a tri-state partnership between the three states within the watershed, established to coordinate management of water resources and quality in the Susquehanna basin. Hintz explains that part of the commission’s role is to provide information to policymakers in New York, Pennsylvania, and Maryland to guide water management, while it also strives to provide reliable information to the public on the state of the water resource. In an atmosphere of mounting policy interest and community interest in the potential effects of fracking, the commission decided in 2009 to implement a watershed-wide monitoring program to assess the impacts of hydraulic fracturing on the waters of the river system.
In 2009, the SRBC mapped out 58 water-quality monitoring sites to install a networked automated continuous water-quality monitoring system engineered by Fondriest Environmental Inc. The system, known as the SRBC Remote Water Quality Monitoring Network (RWQMN), represents one of the largest land areas covered by a comprehensive water-quality monitoring program in the United States.
“The reason we went with continuous monitoring was because you wouldn’t want to miss anything,” says Hintz. “With continuous automated monitoring you can see what’s going on at any time.”
Paul Nieberding, general manager at Fondriest Environmental Inc., explains Fondriest’s key role in the project as the “systems integrator” for the various water-quality monitoring and logging technologies deployed across the network. Although the components of Fondriest’s monitoring systems are manufactured by a number of different companies, he says, the firm “does a lot of engineering” to optimize how the components work together as a comprehensive system. In fact, Hintz says the SRBC had considerable previous experience with some of the individual components included in the Fondriest system in various applications before beginning to work with the company on development of the network.
The SRBC selected to monitor parameters that would serve to indicate the general health of rivers and streams, such as temperature, pH, conductance, dissolved oxygen, turbidity, and water depth, each readable through the YSI V2-2 Multi-Parameter Water Quality Sonde modules included in the package engineered by Fondriest.
According to Hintz, conductance is “the primary indicator parameter of concern” associated with natural gas drilling, based on “the significant concentrations of chlorides and dissolved solids present in gas drilling wastewater.” But along with monitoring conductance, she says, obtaining information on turbidity increases can provide important information indicating issues associated with sediment from erosion problems, either natural or caused by construction activities and road damage. Other parameters such as pH have the potential for indicating the presence of contamination as well. The YSI V2-2 Multi-Parameter Water Quality Sonde system that Fondriest selected for the SRBC RWQMN has the capability to provide data on each of these parameters.
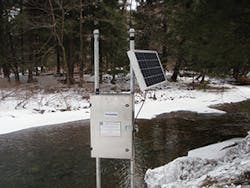
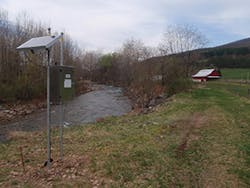
Each monitoring station deployed across the network consists of a multi-parameter sonde placed in protective housing in free-flowing water and has the associated telemetry, facilitated by either the NexSens 3100-iSIC or 6100-iSIC data logger, to deliver this material to the project computer. The 3100-iSIC features a built-in cellular modem, allowing it to transfer data to the project computer over the Internet using a cellular data plan. The 6100-iSIC uses Iridium satellite telemetry to provide the data link to the project computer, making it suitable for areas in the network that have little or no cellular reception. The sonde collects water-quality parameters every five minutes with data transmission varying based on the type of transmission (every two hours if cellular, every four hours if transmitted by satellite). If key parameters surpass normal levels, the station triggers an alarm to prompt an investigation.
Nieberding says that users of remote automated monitoring systems should put some careful thought into site selection. “If you want to measure water level, you want the probe on a straight stretch of river. Additionally, you want to avoid areas where there is a lot of potential for debris.” When a power source must be supplied, he notes, solar panels should be situated above the flood line. A certain amount of consideration must also be given to avoiding the prospect of vandalism to the instruments by situating them in reasonably secured locations when feasible.
Configuring the SRBC’s monitoring system “was fairly straightforward,” he says. “SRBC wanted a system they could replicate at every location—that has identical sensors. In general, the only differences between the sites were whether they’d be supplied with a satellite modem or a cellular modem.”
The SRBC staff visits each station at approximately six- to eight-week intervals to service the equipment and bring each sonde back to the lab for calibration and cleaning before redeploying it at another station.
“Sensors can be swapped out in the field,” says Nieberding, noting that the SRBC has “the benefit of having several spare instruments” that can be used to replace instruments that encounter a problem in the field.
Hintz says the networked installation has exceeded expectations. “We have a large land area to cover. If there’s any malfunction, it can take as long as few hours to get to the site.” However, she says, “Overall it’s good equipment; we don’t run into a lot of issues like that. We tend to fix a lot of things in-house.” As an illustration, she says, “If it’s a data storage issue, we can communicate with this equipment in-house.”
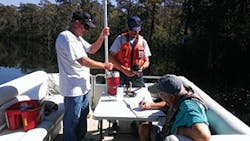
Sampling by boat on the Waccamaw River because of high floodwaters
Operational staff for the RWQMN includes, she says, “two environmental technicians that spend the majority of their time servicing the equipment and collecting the data. There are several of us who spend a lot of time looking at the data once it’s in-house to make sure the data is in order and removing any suspect data.”
Data are automatically imported into the SRBC’s database and within a few minutes are posted without correction (labeled “provisional”) for public access on the SRBC’s website at http://mdw.srbc.net/remotewaterquality. More comprehensive data reports are scheduled to be posted to the website twice a year. These reports include the corrected versions of the continuous data records as well as other data collected during routine maintenance visits.
The SRBC published a report on the results of the monitoring effort in 2015 and plans to publish a follow-up within the next year. “We currently haven’t seen water-quality changes in conductance and turbidity since we’ve been monitoring, but that data only focuses on a four-year period. We definitely would like to see a larger data set to see if we are seeing impacts either from Marcellus or anything else that’s happening in the watershed,” says Hintz.
The Color of Water
As the water in the Waccamaw River meanders slowly toward the Winyah Bay, it carries with it an eerie coloration. “The water looks like tea: it’s clear but dark colored,” explains Christine Ellis. But she says that’s not a flaw; that’s what nature intended. The Waccamaw is what is known as a blackwater river. “It’s very interesting. It’s a real coastal river with huge wetlands, and the water that comes from the wetlands is what brings into the main channel the organic materials that cause that coloration of the water.”
But Ellis, who is deputy director and river advocate for the Waccamaw Riverkeeper, believes the confluence of a number of forces could any day affect water quality and tip the delicate balance and harmony that nature has long established in the river system. According to Ellis, even after coastal development in South Carolina had virtually filled every available inch of shoreline frontage, people still wanted to move to the area in droves, and builders began to venture farther inland. This real estate boom eventually encompassed the Waccamaw River region. Such a drastic change in land-use patterns could also change the character of the river and its waters. However, she believes putting in place a good water-quality monitoring program can provide valuable data about baseline conditions in the river and its tributaries to help detect changes in water quality and guide policy and management decisions to protect the resource.
In 2006, funded by a three-year EPA 319 Grant and a cooperative agreement with Waccamaw Riverkeeper and Coastal Carolina University, the Winyah Rivers Foundation initiated a large-scale water-quality monitoring program. The monitoring program deploys 50 volunteers organized in self-managed teams to conduct regular water monitoring operations at 18 different sites.
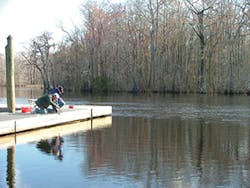
Sampling at Bucksport Landing
Using handheld meters, the volunteers gather information on dissolved oxygen, conductivity, and pH and associated temperatures. In addition, they collect water samples to measure turbidity using a bench top turbidity meter. Water samples are also tested for bacteria and plated, incubated, and read for total coliform and E. coli bacteria, and with colormetric strips, volunteers test for the nutrients ammonia, nitrate, and nitrites.
Expressing her concern for the waterways that often get little attention when there is surf and sand nearby, Ellis says, “I’m not from here, but all you hear about is the ocean. But the system of rivers that merge and empty into the Winyah Bay are an untapped resource.” She explains that the river system to which the Waccamaw contributes feeds the Winyah Bay, the third-largest coastal estuary on the East Coast. “Upstream of the bay is a recreational fishery, and in its lower stretches a sports fishery, including an important habitat for the sturgeon as well as historic habitat for American eel and shad,” she says. The bay also supports a major shrimp fishery.
“Not to downplay the beaches, which lure one million people each day during peak season,” says Ellis, but the rivers farther inland are potentially equally attractive and represent a possible alternative to the crowded beachfronts as “an ecotourism opportunity.” But, she adds, that depends on protecting the water quality.
After the initial three years of EPA grant funding, the Winyah River Foundation worked out sustainable funding for its monitoring programs through relationships with local municipalities in exchange for providing services to help partnering local jurisdictions satisfy National Pollutant Discharge Elimination System (NPDES) permit requirements as the local jurisdictions expanded to meet qualifications of the pollution control mandate.
High Standards
Ellis says she decided to make a switch in monitoring equipment mid-project, when the instruments in use at the beginning of the project became obsolete and the replacements the original supplier had offered didn’t appear to meet the standards the project required.
As she was selecting replacement hardware, Ellis says, Thermo Fisher Scientific loaned the program samples of the Thermo Scientific Orion Star A3295 meter kits for a tryout, giving volunteers the opportunity to evaluate the Orion unit’s performance compared to the replacement monitors offered by the previous supplier. “The volunteers really liked them, partly, because it’s a multiprobe meter—very user friendly, with a very friendly interface,” says Ellis.
Furthermore, to meet the quality standards of the multiple end users, including government agencies, Ellis says the data needed to be of the highest quality. “The original vendor’s replacement model didn’t meet our data-quality objectives.” By contrast, she says, side-by-side comparisons of the Orion sensors and USGS sensors at select locations on the Waccamaw River to collect data on common parameters demonstrated that the Orion sensors would “deliver comparable results,” reinforcing the volunteers’ preference.
Ellis launched the use of Thermo Scientific’s Orion in North Carolina and later expanded it across the monitoring effort, which stretched into coastal South Carolina as well. “The learning curve was pretty quick. We had training sessions in the lab and in the field. It’s easy to do the calibrations. If a team has one site to monitor, they can do a check before they leave home,” says Ellis.
“We’re definitely getting a better feel in the Waccamaw for what are the real pH levels and what are the real dissolved oxygen levels. Blackwater rivers have a naturally lower dissolved oxygen and naturally lower pH because of the tannins or organic materials in the water.”
She says volunteers and staff have used the Orion handheld meters not only to complete regularly scheduled monitoring tasks and collect data on the river ecology, but also to investigate anomalies in water quality. They’ve used them to narrow down potential sources of problematic discharges, sharing the information gathered with the local stormwater departments who can then direct any corrective measures.
“It can be kind of fun,” says Ellis. “We have an active investigation in one of the tributaries, at the request of the community, who had observed increased turbidity in the vicinity of Sterritt Swamp, a tributary that enters the Waccamaw while its headwaters disappear into the surrounding rural areas and forests. We’ve gone back several times to visit development sites, animal boarding facilities, and other land uses in the rural landscape to narrow down the possible sources of the discharge one by one. It’s been a persistent issue, and we’re still trying to figure it out.”
West Creek
On solving the wider mysteries of the Waccamaw and how it functions as a blackwater river system, Ellis says, “In South Carolina we’ve got 10 years of data. You can really do some good analysis with that much data. In North Carolina we have four years of data. Generally, people think of three years of data as being capable of showing trends over time, so we’re starting to see to be able to determine what’s normal for different seasonal conditions.”
When Dirty Water Takes a Vacation
Elevated levels of pathogenic organisms have been found in waters near coastal stormwater outfalls around the world. US EPA has identified ocean outfall research as a high priority. Losing beach vacationers to pollution advisories can cost coastal communities millions of dollars in revenue.
In a study led by Mike Piehler, associate professor at the University of North Carolina (UNC) Chapel Hill Institute of Marine Science (IMS), researchers from UNC IMS and the UNC Coastal Studies Institute have been studying water quality at ocean outfalls in Dare County, NC, to assess indicators of pathogens carried by stormwater toward the coastal beaches. As part of the research, the North Carolina Department of Environment and Natural Resources (NCDENR) funded monitoring stations at nine sites on North Carolina’s Outer Banks.
The project focused on assessing indicators of pathogens at coastal stormwater outfalls. The study area included outfalls contributing to swimming waters that prior to the study had periodically been posted for closure due to pathogen-related water-quality violations. Piehler says the ultimate goal of the study through its various phases and analyses is to locate the sources of pathogens and pollutants entering the water column mixed with stormwater and to provide information to guide policy and implementation of best management practices.
Upstream of each outfall included in the study, researchers collected water-level data using Level Troll 500 instruments. Information collected was used to help researchers assess the most likely source of the flow for each particular stormwater event. When a storm occurred, Troll 9500 multiparameter sondes located at each outfall measured and logged water level, temperature, conductivity, and turbidity. In addition, Doppler flow modules at each site were set up to trigger Isco 6712 samplers to collect approximately 100 water samples per storm event. After an event, a laboratory analyzed the samples for Enterococcus sp., E. coli, total coliforms, chlorophyll a, and salinity.
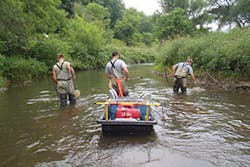
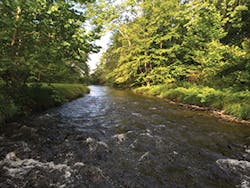
Bowman Creek, one of the monitored creeks
in the Susquehanna River basin
Piehler says the study represented a “great opportunity to continuously measure flow, then take discrete samples for concentrations of fecal indicator bacteria throughout baseflow and stormflow.” He explains, “The In-Situ instruments allowed us to measure water level throughout the watershed, and that enabled us to get a good measure of how water levels change, leading up to and through the storms.” Along with rainfall data, the water-quality information helped researchers understand storm duration and site conditions during a storm, Piehler says.
“It gave us a comprehensive picture of when problematic materials were delivered, and in what total mass, giving a good sense of how much pollution was delivered to the system. A lot of these were swimming waters; our goal was to understand the timing of the delivery of these materials.”
Coupled with the Isco automated water sampler and Isco Doppler velocity flow modules, which were deployed at each of the outfalls engaged in the study, In-Situ water-quality sondes were deployed to measure turbidity, conductivity, and temperature.
Isco velocity flow modules helped the researchers to detect, based on the velocity or the water level, when the storms started. Automatic triggers, based on the velocity or water levels, instructed the Isco sampler to adjust sampling rates according to site conditions, explains Piehler. For example, “As a storm trigger is reached, if you’ve been sampling once a day, you can preset the Isco to begin sampling at a higher frequency, perhaps once every three hours during the storm.”
He adds, “The Isco samplers were very user friendly once you know the how the menus are set up.” Researchers could use the Isco automated samplers’ controls to communicate with the In-Situ Troll sondes with which they were interfaced, very seldom finding the need to employ the Troll keypad controls.
While the In-Situ Trolls store the data onboard, they can also be outfitted with cell transmission capability. However, says Piehler, “In this case we were close enough to the sites that we were able to gather the data ourselves.”
When rain was scarce, as it was during a lengthy drought that occurred at the beginning of the study, it was nonetheless critical to gather reliable water-quality data from the samplers at the outfall pipes to build a comprehensive understanding of the delivery of pollutants to the beach. If rainfall was expected to be too light to trigger the Isco samplers, Piehler says, “Often, we’d go out and trigger them ourselves.”
He notes that the flat terrain created one of the greatest challenges in dealing with water level and velocity data in coastal environments. Water flows downhill most of the time; however, according to Piehler, in coastal settings there are exceptions that must be taken into account to paint an accurate picture of flows and sources. He explains, “If the wind shifts direction, you can change water flow very quickly.
“We spent a lot of time analyzing the hydrograph and looking to know when it was raining, and which direction the wind was blowing, and where you were in the tidal cycle, because obviously if you have a very high tide, fresh water is not going to move off the watershed in the same way it would if you have a very low tide. We spent quite a bit of time making sure we understood the full context of the systems where we were working.”
Among the major findings of the research were some surprises. Although it was unsurprising that the outfalls targeted for the study were sources of fecal indicator bacteria, Piehler says, the presumption was that first-flush patterns would be strongly indicated “where you expect everything to be delivered very early in the storm.” However, he says that first-flush scenario “did not accurately reflect what was happening in the system. We saw fairly persistently high concentrations of fecal indicators through the duration of many storms, indicating that there were, perhaps, a number of different sources, including the first-flush things that come off of surfaces, like roads and ditches that drain into this area, but then potentially other sources of bacterial indicators that followed that, such as groundwater.”
He says the finding pointed to an unspecified but “substantial potential source” of fecal indicator contamination. This new information demonstrates that “remedial strategies are going to have to treat virtually all of the storm. Doing that in coastal areas is very challenging, because land in the coastal area is very expensive and the height to the groundwater table is very short.”
Piehler says the new information could lead to new thinking about how to address potential sources of contamination in coastal watersheds. “I don’t think anybody has the answer yet, but there are a lot of people trying to think about it. The key is being able to handle that volume of water in an area of landscape where—especially in popular tourist areas—the demand for development land means there is very little surface area to site remedial structures.”
