GIS technology—short for Geographic Information Systems—isn’t new. Water districts can use this technology to create interactive maps that help them navigate their system of pipes, valves, pumps, and stations.
But it’s when districts combine GIS with Advanced Metering Infrastructure (AMI) and automatic meter reading (AMR) that they can best boost their efficiency and enhance the customer service they provide to their end-users.
This isn’t a surprise. After all, AMI allows utilities to spot spikes in water usage throughout their systems—something that can help them quickly detect and repair leaks before they turn into larger problems. With AMI, utilities can also better show their customers just how much water they used on specific days. Customers can then determine whether they were, say, filling a pool, or whether they might have an undetected leak or a toilet that is constantly running.
AMR helps utilities save dollars. Instead of having to send employees out into the field to read meters by hand, they can rely on AMR to collect the water-usage data they have. Utilities will then have more money to spend on improvements to their system. At the same time, they’ll be able to better manage employees who previously focused on reading meters—perhaps training them to handle customer service calls or adding them to their repair crews. This is especially important today, when many water districts continue to rely on skeleton staffs.
When utilities use all three of these technologies—GIS, AMI, and AMR—they give themselves the best chance to both reduce their operating costs and better service their end-users.
Putting All The Pieces Together
Ryan Taylor, GIS expert with FlowWorks, says water districts that use both GIS and AMI/AMR technology together are able to create a water distribution system in which technicians, engineers, and maintenance personnel can immediately see how all the pieces of the system connect.
That can only help water districts provide better service to their customers, Taylor says. “When you use GIS, you have everything connected in one system,” says Taylor. “All the meters and pipes and manholes are all connected in one system. If there is a break in a water main, a break in a pipe, or an issue at one of your pump stations, GIS can help you quickly search upstream to figure out how many customers are affected by that issue, and what the likelihood is of there being a larger issue downstream of that.”
This is a change from the way water districts have long operated, Taylor says. Without that combination of GIS and AMR/AMI technology, most of this information had been mostly locked up, available only to the engineers who had access to a water district’s technology.
Say there is a water main break in one of the main supply or sewer lines of a district. Using GIS, the district’s personnel can determine how many of their customers or how many homes or businesses might be out of service while crews repair the damaged water main. The district can then contact these home and business owners with this information.
By using GIS and AMR/AMI technology together, water utilities can also boost their ability to spend their money wisely.
Taylor gives a good example: A municipality might want to install rain gauges across the city it serves to measure average rainfalls. That municipality might have a budget of just $20,000 for this project, enough for a limited number of gauges.
Taylor says that GIS technology can help municipalities create virtual stations to fill in the gaps where they can’t afford to install actual rainfall meters. GIS can interpolate and triangulate between existing stations to create a virtual station.
“We don’t have a station on this rooftop, but if we did, it would say that we had rainfall here of about this much,” says Taylor. “Being able to do this, to reduce the number of actual stations that need to be installed, can result in a huge cost savings to water districts.”
For Taylor, this is an important point. He says that a growing number of water districts are recognizing how using AMR/AMI and GIS together can help them provide more services to their customers at lower costs.
“So many of our clients only have so much capital available to them to run the programs they want,” says Taylor. “This technology can help them stretch their resources.”
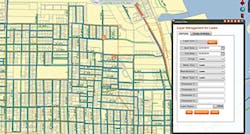
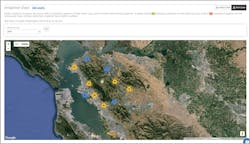
An example of GIS/AMI integration
More Power—And Information—To The End-Users
It’s true that major cities and the water departments that serve them have long invested in GIS technology. But the ways in which water districts are using the combination of GIS and AMR/AMI are changing.
Taylor says, during the past 10 to 15 years, more water districts have pushed the data generated by their GIS and AMR/AMI technology in front of their customers. This gives customers a chance to see how their water consumption compares with their neighbors’. It might inspire customers to water their lawns less frequently during warm months or take shorter showers.
Other municipalities provide their customers with online GIS maps that end-users can scroll through to see where capital improvements are planned or if there are any active service emergencies.
“It’s like when someone is buying a home. They don’t call up the realtor and say they’re looking for a three-bedroom, two-bath house and wait for the agent to pick them up,” says Taylor. “Now, the potential buyers do the research themselves. They log onto real estate websites or go to an app and find all the dots on a map. They choose which addresses they want their Realtor to show them. How water districts and cities are using GIS isn’t too much different.”
Taylor says that homeowners might notice water running down their street, a sign of a likely water main break. Homeowners can then log onto the city’s website, click on that water main on an online map, and start a service request to the city.
“It’s the same as finding what prices nearby homes sold for, owner information, or the closest community center to your house,” says Taylor. “GIS is definitely being pushed out into the citizens’ hands more often. It’s all there for you to use now.”
The Hurdles Districts Face
This raises the question: Why aren’t even more districts investing in GIS and AMI/AMR technology? According to the 2014 Scott Report: North American Deployments of Automated Metering Devices, only 14% of all water utility customers were using AMI or fixed-network meters in their homes or businesses.
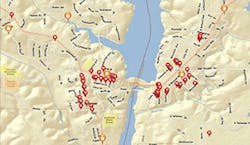
Tracking patterns of high water use can help identify irrigation violators.

That’s not a huge percentage, but the report mentions that this technology is growing. According to the report, fixed-network AMI meter shipments to water utilities have risen from less than 500,000 a year in 2005 to just under 3 million in 2014.
Taylor says that many utilities don’t invest in GIS and AMR/AMI because of budget issues. Others don’t think they have a large enough staff of technicians to handle the work involved in setting up GIS and AMI/AMR systems throughout the water distribution networks, he says.
“It is a bit of an initial upfront investment,” says Taylor. “It’s not as simple as pushing a button and having that information pushed out to the public. It takes some work to develop the web-mapping applications. For smaller municipalities and cities, they often don’t have the budget to do it.”
Taylor says that he expects this to change. GIS and AMR/AMI technologies have a long enough track record now that even smaller districts can see the financial benefits of investing in these systems.
And as even more utilities demonstrate that these technologies save them money each year, while providing a more satisfying customer service experience to their end-users, more water districts will scrape together the funds they need to cover the initial investment that these systems require, Taylor says.
“As more and more of the big guys start investing in this, the smaller organizations will start seeing the value,” he says. “They may start diverting the funds from other investments so that they can launch their own GIS. It has been the larger organizations that have started to push GIS out to the citizens. They have the deeper pockets. Now that the smaller organizations are seeing how successful it can be, we are seeing more of a push to adopt this technology.”
David Totman, industry manager for the global water practice of Esri, says that his company estimates that more than 75% of medium-to-large water utilities use GIS to help manage their water systems. The numbers for AMR and AMI are a different story, though, he says, with Esri estimating that only 25% of these utilities use AMR, and a far smaller percentage use AMI technology.
Why aren’t numbers higher for AMI and AMR? Totman says that cost is a challenge for municipalities. But there is also a mentality among end-users that undervalues clean, treated water, and the cost that utilities pay to deliver that water, Totman says.
“We consider clean water a right, and not a privilege,” says Totman. “Customers do not understand the complexities of delivering safe drinking water to their faucets. People turn on their faucets and water comes out. They have no concept of the work that goes into diverting that water from a river, treating it, distributing it, and storing it in tanks. They pay their monthly bills and that water better flow. It’s an entitlement mentality.”
This mentality means that there is little push from end-users for a more efficient monitoring and delivery system for their water. Sure, consumers want to pay lower taxes and fees. But they often don’t care if their utilities can operate more efficiently with the addition of AMI and AMR technology.
“I’ve heard users cite privacy issues,” says Totman. “People don’t like to be monitored. They say that no one needs to know how much water they are using. Well, yes, we do. It is an education process that the utilities have to take on.”
Other districts worry that installing GIS is too expensive and time-consuming, but Totman says that this is inaccurate.
“There is a stigma that GIS is expensive and takes too long to implement,” says Totman. “This may have been true 10 years ago, but it is not so true today. We are not your father’s GIS. Web GIS is very affordable, and solutions can be implemented in days, not months.”
The Financial Benefits
Taylor says that manufacturers of GIS, AMR, and AMI technologies need to emphasize the financial benefits that these technologies provide to water districts, especially when these systems are used together.
Utilities, and the governing bodies that oversee them, rightly focus on their bottom lines. The initial cost of embracing these technologies can be intimidating. But once utilities see how much money this technology can save them each year that initial upfront investment should no longer seem so foreboding. Manufacturers, after all, can easily show utilities how GIS, AMR, and AMI technology can generate enough savings each year to quickly erase the upfront installation and training costs that come with them.
“The major thing is, once you have this technology installed, there is a lot less overhead for a city to deal with,” says Taylor.
As Taylor says, instead of having to call city staff to ask questions, residents can go online to study maps or access the usage data generated by AMI technology.
“There are a lot less one-on-one customer touches from the city’s standpoint,” says Taylor. “It is an upfront cost that pays off in the end in terms of information accessibility. There is less digging from the city side. Cities will need less citizen interaction.”
End-users, for example, can log a service request online with the city to report a damaged fire hydrant that is leaking water outside their home. The city will then handle that request through its GIS technology, creating a work order and sending out crews armed with their own online maps. A city’s water district can also use its technology to determine how that hydrant relates to the rest of the users around it.
If the utility can’t fix the problem without shutting off some of its water supply, it can use GIS to contact those end-users who will be affected, Taylor says.
“This is only going to become more widespread,” he says. “The installation of these technologies
is getting easier to do. I don’t see the number of installations slowing anytime soon.”
Totman says that the combination of GIS and AMI can give water district officials a far more in-depth view of their water systems.
“As a real-time sensored network, AMI is your eyes and ears into operational system performance,” says Totman. “With AMI coupled with GIS, you always know where, what, why, and when. Water professionals can then better determine who and how to react to any situation.”
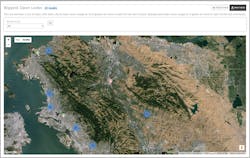
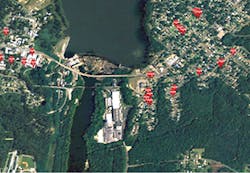
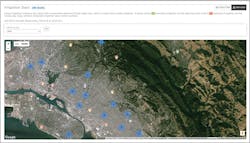
Screenshots show maps used for detecting irrigation violations and leaks.
Boosting The Bottom Line
Jeff Lipton, director of marketing for WaterSmart Software, says that municipalities that use GIS in conjunction with AMI systems can also reduce their yearly operating costs in several ways.
As an example, water districts can deploy their repair crews more efficiently. Instead of having these crews waste fuel on circuitous routes every time there is a water main break or leaking pipe to fix, districts can rely on GIS to send their repair crews to problem areas in the most fuel-efficient way possible.
“With GIS, crews can know exactly where to go and in what sequence,” says Lipton. “That’s a better option than having crews driving around without a plan.”
Lipton says that those utilities using GIS are relying on the technology to better manage and track the many pieces of their water distribution systems.
Many water districts and municipalities are relying on old systems. The managers and maintenance personnel might not even know where all of their pipes, pumps, and valves are located.
“Given that most of the infrastructure is under the ground, older assets are often difficult to identify,” says Lipton. “They are often collected in manual formats. These districts don’t have a way to holistically view their assets in three dimensions. It requires more sophisticated GIS and 3D modeling to better understand where these assets are located.”
Information is Key
Of course, districts still need to acquire data about their assets from the field, Lipton says. But once water districts do this, they can use GIS technology to consolidate the views of these assets. This improves their ability to manage their infrastructure rehabilitation, Lipton says. Municipalities can then date the age of their assets, tie it to their SCADA systems, and best identify where problems are occurring or might occur in the near future. They can then send field staff out to address the challenges in their systems.
As an example, Lipton points to a water main break that made headlines in 2014. That’s when a City of Los Angeles water main ruptured near UCLA, sending nearly 10 million gallons of water rushing across the campus. The pipe that broke was 93 years old.
The water from the break flooded a parking garage and a gymnasium. City water officials couldn’t shut off the water immediately, because they needed to identify which valves they could shut down without putting too much pressure on other areas of their water-distribution systems. “It really illustrates the challenges you face when you don’t really know your system,” says Lipton.
Water districts can use GIS maps when they need to send out staffers when homeowners in drought-prone areas are using too much water on their lawns, Lipton says. Again, districts can direct their water enforcement vehicles to the scenes of violations by using the most efficient route possible, saving a significant amount on fuel costs throughout the year.
Utilities can do the same when end-users request in-home or in-business audits or when the water district receives turn-off and turn-on requests. With GIS maps, utilities can plan out routes for their drivers that consume the least amount of fuel.
There are some utilities—though not many yet—that are either using or investigating using GIS and AMI technology together, along with aerial photography, to develop household-specific water budgets. Using all of these technologies together, utilities can determine how much water a home or business should consume, and then inform these users when they are using more than their ideal allocation.
Lipton says that utilities can calculate these water budgets based on the size of a property, the number of occupants, and the areas outside it that need irrigation. Utilities can even determine where evaporation is most likely to happen on a property based on tree coverings.
“They can create highly accurate budgets of how much water a home is supposed to use,” says Lipton.
Using AMI, utilities can then determine—based on the amount of water a property should be consuming—if there might be leaks in the pipes of a home or business. Lipton says that sudden increases in water use past a property’s allocated water budget can be evidence that there is a leak.
Utilities can quickly send over crews before the leak turns into an even bigger and costlier problem, Lipton says.
Lipton expects more municipalities to invest in GIS, AMI, and AMR technology in the coming years. But utilities still face challenges in making this move.
“For a city with 100,000 or 150,000 water meters, it can take three to four years to replace all of those meters, and it can cost tens or hundreds of millions of dollars,” says Lipton. “In the end, the rate payers have to pay for that. Getting the political support to get these investments and this technology, requires that end-users understand all the work and cost that goes into providing reliable and high-quality water services. It is critical that utilities continue to communicate the value of the services that they provide. If they don’t, they won’t get the support they need to raise rates.”