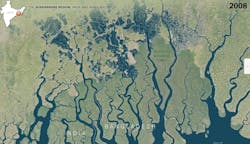
Fluid Dynamics: A Visual Record of the World’s Surface Water
Blue rivulets pulse and migrate. Reservoirs expand and shrink as snowmelt feeds them and flows away. Farmland becomes indigo as waters are diverted to flood them and then drained. A new series of maps published last week in the journal Nature and displayed in the New York Times are a reminder that our planet’s water is in continual motion.
Sources: Water extent data from the European Commission Joint Research Center and Google. Satellite imagery for base maps from Google. Some roads data from Open Street Map contributors.
Scientists with the European Commission’s Joint Research Center in Ispra, Italy, in collaboration with Google engineers, used high-resolution satellite images to capture changes in rivers, lakes, and other bodies of water over a period of three decades. And the images show—with remarkable clarity—the effects of both natural and human forces on the pathways of water that crisscross the Earth’s surface.
The researchers meticulously analyzed 3,066,102 Landsat images taken at monthly intervals between 1984 and 2015. They classified each pixel—which represented a 100 by 100 foot block of the Earth’s surface—as water, land, or a non-valid observation. To process the 1.8 terabytes of data, they employed a system of 10,000 computers and the expertise of the Google Earth platform.
The resulting record of our planet’s water history was used to produce a set of maps that document the world’s surface water dynamics. The maps reveal how activities like damming and diverting water systems can alter the Earth’s geography. They also show notable shifts in hydrology. Between 1994 and 2015 surface water disappeared from an area measuring almost 90,000 square kilometers. But during the same period of time, 184,000 square kilometers of permanent surface water formed elsewhere. This redistribution of water reinforces the importance of thoughtful and comprehensive resource management on an international level.
“We anticipate that this freely available data will improve the modelling of surface forcing, provide evidence of state and change in wetland ecotones (the transition areas between biomes), and inform water-management decision-making,” the researchers explain in the study’s abstract. They’re also simply stunning to look at.
What other conclusions do you think that researchers might draw from these satellite images?

