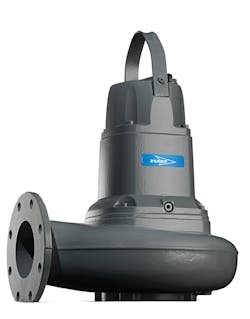
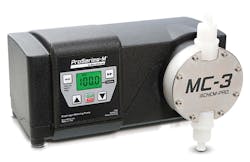
A pump is a mechanical device that is used to transport and elevate liquids from Point A (the “reservoir”) to Point B (the “discharge”). But what type of pump should be used? That depends largely on two factors: the physical characteristics of the liquid being pumped and the configuration of the system of pipes through which the pump is transporting the liquid. Given the potentially wide variation in operating conditions and the physical/chemical characteristics of the liquids being pumped, it becomes critical to use accurate methods to specify the proper size and type of pump required.
LIQUID CHARACTERISTICS
The type of pump required depends in large part on the type of liquids being pumped. While certain pumps can be used in various operating environments and be used to transport different types of fluids — potable water, groundwater, wastewater, water for firefighting, industrial discharge water, agricultural water, gasoline and diesel fuels, oils and other lubricants, slurries and other admixtures — each has different inherent chemical and physical characteristics, and these can be changed further when subject to different environmental or operational conditions.
Aside from its unit density, the primary physical characteristic of a liquid is its viscosity or consistency. Simply put, viscosity is a physical characteristic describing the resistance a fluid exerts against the forces causing it to flow. This is especially apparent along the interior surface of a pipe and the portion of the fluid in immediate contact with the interior pipe wall. Think of the flowing liquid as having rings (like the trunk of a tree), with each ring of fluid having contact “surface” with the adjacent inner and outer rings and having internal friction forces being generated on these “surfaces.”
Frictional resistance is highest along the contact surface with the interior pipe wall and least near the center line of the flow. This explains why fluid tends to move faster along the center of the flow path than around the exterior flow limits. As a result, liquids with high viscosity generate more resistance to flow and do not flow as fast as liquids with low viscosity.
Viscosity derives from the chemical and molecular characteristics of the liquid and is primarily the result of three factors: the forces which mediate interaction between molecules, including forces of attraction or repulsion (intermolecular forces) with stronger forces creating higher viscosities; the size of the molecules (which is especially pronounced for polymers such as hydrocarbons since larger molecules have more difficulty sliding past each other); and the shape of the molecules (molecules with multiple branches tend to get tangled up in each other compared to linear molecules, which in turn can stack up on each other compared to short molecules).
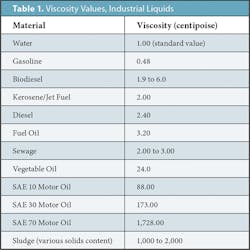
The standard liquid used to measure against all others is simple water. However, viscosity also changes with the temperature of the liquid and the pressure to which it is subjected. An increase in temperature tends to decrease a liquid’s inherent viscosity. So, a standard temperature of 50˚F (10˚C) at one atmosphere is used to determine water’s baseline viscosity. The viscosity of water is often specified as 0.0000141 ft2 per second at 50˚F (in SI units, viscosity is given in centipoise or 0.001 Pascals x second, with water viscosity designated as having a viscosity equal to 1 centipoise). The viscosity of other fluids is listed in Table 1.
Viscosity values can then be used to determine the Reynold’s Number (Re) of the pipe flow. This value is calculated by multiplying the flow velocity (V, feet per second) by the pipe diameter (D, feet) and then dividing the result by the viscosity of the liquid (v, ft2 per second).
Re = (V * D) / v
The Reynolds number is then used to determine the friction coefficient of the flow by cross referencing its value to the laminar flow, smooth-walled pipe curve of the Moody chart (see Figure 1).
SYSTEM RESISTANCE
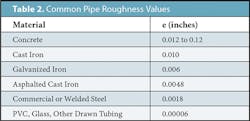
Different from viscosity but acting in concert with it to resist liquid flows is the roughness of the pipe’s interior wall surface. Though most pipe flow analyses can assume that the pipe’s interior wall surface is “smooth,” in reality many types of pipe have relatively high values for roughness. These differences are summarized in Table 2.
Once the friction factor is determined, the head losses affecting the flow can be estimated. But first, the flow velocity needs to be calculated. This is done by dividing the flow rate (Q, cubic feet per second) by the cross-sectional area of the pipe interior (A, square feet) as determined by the formula for a circle:
A = pi * (r2)
With the flow velocity known, the friction head loss (Hf, feet) can be determined. This is done by multiplying the friction factor from the Moody Chart (f, dimensionless) by the length of the pipe (L, feet) and by the velocity (V, feet per second) and then dividing this value by the result of multiplying twice the diameter by acceleration due to gravity:
Hf = (f * L * V) / (2 * D * g)
The next component of the operational head value is static head (Hs, feet). This represents the elevation difference that a pump has to overcome when lifting a liquid to its higher discharge point. This is calculated by subtracting the elevation of the pump inlet point (Ep, feet) from the elevation of the pipe system discharge point (Ed, feet):
Hs = Ed – Ep
The last element of system resistance is the velocity head (Hv). This is the velocity of a fluid expressed in terms of the head or static pressure required to produce that velocity, or the amount of potential energy required to accelerate a fluid to its actual flowing velocity. This is determined by dividing the velocity squared (V2, ft2/second2) by twice the acceleration due to gravity (g, 32.17 ft per second2):
Hv = (V2) / (2 * g)
Adding all three of these pressure head values together gives the system total resistance pressure:
Ht = Hf + Hs + Hv (feet)
Feet of head can be converted to standard measurements of pressure (such as lbs per square inch, psi) by equating it to the pressure generated by the weight of a one-foot-high column of water. Water weighs 62.428 lbs per cubic foot (pcf). A one-foot-high column would exert a pressure on its bottom surface of 62.428 lbs per square foot (psf) or 0.43 psi.
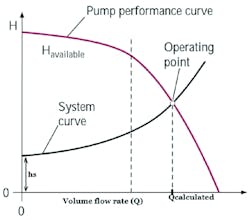
Note that these total system heads will vary with flow velocity and the resultant flow rate. Only the static head remains unchanged by altering the flow rate so long as the pipe system’s discharge point remains unchanged. By altering the flow rate, the friction factor changes and with it the resultant friction head. Furthermore, changing the flow rate results in concurrent changes in flow velocity, thus altering the velocity head. Altering these two factors can alter the total system head. Graphing the changes in the total head compared to changes in flow rate produces the system resistance curve. The resultant line curves upward with increased flow rates starting from a minimum head baseline defined by the system’s static head (see Figure 2).
PUMP PERFORMANCE, TYPES, MECHANICS, AND POWER REQUIREMENTS
Now that we have a clear idea of the system characteristics affecting the pump operations we can determine the type of pump performance required to operate effectively under these conditions. In addition to the system curve, pump operations are evaluated using several pump performance curves.
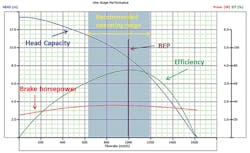
This second set of curves is a function of the pump’s inherent mechanical capabilities and design specifications. Actually, pump performance is defined by a family of four curves: the efficiency curve, which compares efficiency to the flow rate (measured in percent); pressure head delivered, which compares the pressure head capacity generated by the pump to the flow rate (measured in feet); and break horsepower (or BHP), which compares the pump’s energy requirements to the flow rate (measured in watts) and the pump’s positive suction head as it relates to flow rate. Different pump designs and sizes will have different operation characteristics (and often radically different designs). These curves are summarized in Figure 3.
The head capacity curve maxes out at the low end of the flow rate. The energy produced by the pump goes into both moving the fluid and overcoming the resisting head. All other things being equal, at lower flow rates more energy is available for overcoming head. In other words, only a lower flow rate can be pumped at a higher head and vice versa. Available head continues to fall with increased flow rate until maximum flow is reached at minimum head. And this head capacity curve is in relationship with the system resistance curve.
In contrast, the efficiency curve resembles a parabola, starting with zero efficiency when the pump is not operating (at zero head and zero flow rate). It again reaches zero efficiency as the head capacity curve reaches maximum flow rate and minimum head capacity. In between, the pump reaches a peak efficiency point for a given flow rate based on the pump’s design and operation for a given impeller diameter (assuming the pump is a centrifugal pump). This peak efficiency point (Best Efficiency Point, or BEP) defines the operating head and matching flow rate that results in maximum efficiency.
BHP is also a parabolic curve but it is much flatter than the efficiency curve. BHP is not total HP; it is the HP that is actually delivered to the the pump’s drive mechanism and performs actual work. It is the amount of energy delivered to the pump at a given RPM, which in turn relates to the amount of flow. Efficiency relates to BHP by dividing BHP by the pump’s total hydraulic power.
Lastly, Net Positive Suction Head (NPSH) completes the evaluation of a pump’s operational characteristics. There are actually two types of NPSH. The first is the required suction head (NSPHr). This is the suction head required by the pump to prevent cavitation (the formation of bubbles or cavities in liquid, developed in areas of relatively low pressure around an impeller) which can badly damage the pump’s housing or impeller blades. The second is available suction head (NPSHa), the amount of suction head actually generated by the pump. To prevent cavitation and its related damage, NPSHa should exceed NPSHr.
So how do these curves determine a pump’s operation? The head capacity curve is cross-referenced with the system resistance curve. Where the two cross each other is the pump’s operating point for that particular piping configuration. This point defines the flow rate and head while operating. The optimum situation will match this operating point with the BEP, or at least have them both fall within the pump’s recommended operating rage (bounded by a maximum and minimum flow rate).
With performance parameters established, the next step is specifying the size and type of pump. In broad strokes, there are essentially three basic types of pumps: positive displacement pumps; extraction centrifugal pumps (operating outside and above the liquid reservoir being pumped); and submersible centrifugal pumps (installed in the bottom of the liquid reservoir). Each is preferred for a different combination of liquid being pumped, piping configuration, and operational requirements.
As mentioned above, pumps can be designed to manage a wide variety of different types of liquids, each having its own unique physical and chemical characteristics (clear water; water with high total suspended solids content; groundwater extracted from well points; water with large particles, raw sewage, and water pollution; landfill leachate; highly viscous fluids; slurries and sludges; oils and other hydrocarbons). Each type of liquid has a unique viscosity, density, and range of suspended particle sizes. This last item further breaks down pump categories with three additional pump types, based on the size of the particles they are designed to manage. These particles are not necessarily rock or grit; they can consist of organic and man-made waste materials. Water and sewage bearing significant suspended contaminants are classified by particle size (average particle diameter):
- Up to 3/8 inches (fine gravel equivalent) are managed by sump pumps operating at higher head and lower flow.
- 3/8 inch to 1/2 inch (medium gravel sized) are managed by effluent pumps, operating at moderate head and moderate flow.
- 1/2 inch to 2 inches (large gravel and cobbles) are managed by sewage pumps, operating at lower head and higher flow.
- Grinder pumps, which crush particles of all sizes into a slurry prior to pumping.
Centrifugal pumps rely on the force generated by a rapidly spinning rotor enclosed in a watertight metal casing to impel liquid from a central inlet located at the axis of the rotor outwards toward an exit port along the rim of the pump body. The rotor consists of a rotating drive shaft and disk with vanes and blades attached. These pumps generate high flow rates with low-pressure heads.
Some designs utilize flexible impellers instead of fixed vanes. These are elastic impellers that expand to trap fluid and sweep it towards the discharge pipe. This design differs from the standard rotary vane pump’s rigid vanes and operates at higher pressures.
A gear pump design uses the teeth of rapidly spinning enmeshed gears to impart the centrifugal force to impale the liquid forward. These tend to have lower flow rates with higher pressure heads.
Various types of configurations and mechanisms can be used to act as displacement pumps. In general, displacement pumps utilize push instead of the spin of centrifugal pumps to move liquid. The basic version utilizes a reciprocating piston enclosed in a watertight cam that alternatingly fills and then expels liquid with the motion of the piston.
Similar to this in action but differing in design is the bellows pump, which utilizes a bellow cavity instead of a piston, and the diaphragm pump, which uses the reciprocating action of one or more flexible membrane diaphragms that displace the liquid out of the pump.
A modification of the piston pump is the syringe pump. Though it appears similar in design, it functions to pump liquid at high pressure and low flow rates.
Odd designs for specialty applications include flexible liner pumps that utilize the displacement action of a rotating body block against an inert surface of a liner. This design has the advantage of allowing a pump to run dry without burning out.
Lastly, the unique peristaltic tubing design allows for pumping without the mechanism ever coming into contact with the liquid (important when preventing cross-contamination is essential). Here, a pair of rollers is used to squeeze a flexible tubing containing the liquid, pinching the liquid forward from the pump.
MAJOR SUPPLIERS
Since 1901, Xylem/Flygt has provided a complete range of products and solutions for moving water and wastewater, as well as advanced monitoring and control equipment to optimize performance and energy efficiency. Flygt clog-free pumps and mixers are used for extreme applications in wastewater, stormwater, effluent, return activated sludge (RAS) and waste activated sludge (WAS), lightly contaminated water, and clean water applications.
The company’s culture of innovation is exemplified by the world’s first wastewater pumping system with integrated intelligence, the Concertor. The fully integrated system offers a unique synergy between software functions and state-of-the-art hardware. Concertor’s system design works in harmony to reduce total cost of ownership while delivering high quality and reliability. This intelligent control of the wastewater pumping system senses the operating conditions of its environment and adapts its performance in real time to provide feedback to station operators, providing a high degree of operational flexibility. It does so by combining a fully integrated control system with IE4 motor efficiency combined with state-of-the-art N-hydraulic and intelligent functionalities. The built-in intelligence makes it quicker and easier to set up and operate functions that would otherwise require a very sophisticated monitoring and control system.
Godwin pumps, a subsidiary of Xylem/Flgyt has recently introduced the first-in-series Godwin NC150S Dri-Prime® Pump offering a smart solution for water management. It features the company’s unique, self-cleaning, Flygt N-Technology non-clog impeller that can manage even stringy wastewater while providing long-term fuel and energy savings. The smart pump can be monitored and controlled from any smartphone, tablet or desktop computer anywhere in the world with Godwin Field Smart Technology (FST).
Blue-White Industries is an industry-leading manufacturer of water and wastewater treatment equipment including metering pumps (ultrasonic, digital paddlewheel and variable area flow meters). These include the company’s self-priming FLEX-PRO® Peristaltic Pumps that operate at feed rates of over 158 gallons per hour at pressures of 125 psi (288.33 feet of head). An addition to its line of diaphragm pumps includes the CHEM-PRO® with feed rates of 40 gallons per hour at pressures of 175 psi (403.66 feet of head) controlled by a NEMA 4X (IP 66) washdown chemical feed sensor. CHEM-FEED® Diaphragm Pumps utilize an all-ball-bearing, permanently lubricated gear motor for smooth, quiet, powerful operation. Flow is controlled by double ball, inlet, and outlet check valves for optimum seal.


