Data Historian Helps Utility Analyze Diverse Data Streams
by Gary Wong and Ian Scott
The Water Corporation is one of Australia’s largest water service providers with more than AU$10.9 billion invested in water services infrastructure. The Corporation provides water and wastewater services to the burgeoning city of Perth, as well as hundreds of towns and communities spread across the state of Western Australia, an area of over 2.5 million square kilometers. The Water Corporation also provides drainage and irrigation services to thousands of households, businesses and farms across the state.
Water Corporation’s core business is to ensure safe and reliable water and wastewater services. The utility is committed to implementing innovative solutions that will protect the community’s water supplies both now and in the future. This includes an information strategy with two main areas of focus: information analysis, and predictive information and capability planning.
Although the utility has a large number of data-rich applications and information systems, the organization has previously been restricted by two factors: limited integration and lack of analytical capability. Its ability to collect and leverage real-time data to make decisions was limited.
To address its business challenges of combining and analyzing information from disparate systems, Water Corporation turned to the OSIsoft PI System, an enterprise data historian that turns raw process control data into actionable, consistent information.
Info in Action
The PI System is primarily used to gather and organize data from high frequency data sources (SCADA, logger boxes, etc.). It is used by people at different levels in the organization, from service delivery managers to planners. Although SCADA is the primary mechanism for the operators, the system is used for the rest of the organization, providing access to the most valuable sources of data.
With the use of the system, the Water Corporation is currently applying its information strategy in two separate projects: desalination monitoring at the Cockburn Sound plant facility; and Wastewater KPI Management.
Cockburn Sound Desalination Project
Australia’s first, large-scale seawater desalination plant at Kwinana provides Western Australia with an abundant source of drinking water that is completely independent of rainfall. Owned by the Water Corporation and operated by Dégremont until 2031, it is the largest reverse osmosis desalination plant in the southern and eastern hemispheres.
It began delivering drinking water into Perth’s Integrated Water Supply System on November 18, 2006, and is now fully operational. Perth’s largest single source of water, the plant produces an average of 130 million liters of desalinated water per day.
As a requirement for the license issued by Australia’s Department of Environment and Conservation, the Water Corporation must conduct extensive testing across Cockburn Sound to monitor water quality and the potential environmental impacts from dissolved oxygen levels. The PI System was adopted because it enabled the Water Corporation to collect data models from disparate information sources into a single repository. These data sources include weather model information sourced from the Bureau of Meteorology, real-time site environmental measurements of dissolved oxygen levels at three monitoring stations, and desalination plant operations data.
Marine monitoring buoys in Cockburn Sound transmit data on water conductivity, temperature, salinity and dissolved oxygen levels, as well as wind speed and direction, to an Operations Center every 30 minutes via GSM and radio technology.
The desalination plant requires specific data about operating measures, as well as comprehensive monitoring, contingency and regulatory arrangements. The analytical power of the PI System calculation engine is used to produce a predictive model of the environmental parameters. Results are used to predict whether the surrounding environmental conditions may be affected by the brine discharge from the desalination plant. If non-compliant levels are triggered, a reduction or ultimately stoppage of the desalination production output would result.
Reviewed 24 hours a day, 7 days a week, the analyzed data provides a reliable early warning system. Additionally, the sophisticated monitoring demonstrates that the Perth Seawater Desalination Water Plant is environmentally sound.
Wastewater Management
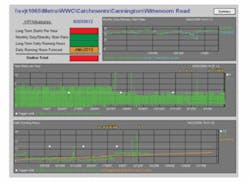
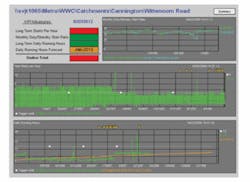
Water Corporation has also implemented a Wastewater KPI Dashboard that provides real-time performance management status and predictive analysis reporting indicative trigger levels for potential alarm excursion scenarios.
Real-time data describing various pumping scenarios is brought into the PI System and analyzed via performance equations to give required summary information (e.g., daily totals, averages). The system is configured to perform a range of analyses automatically with real-time and historical data, such as: comparisons conducted between seasonal periods; and overlaying similar months from a number of different years and contrasting aggregates over two- to five-year periods.
The PI System analytic tools provide the ability to embed analysis and models automatically, as opposed to manually combing data from disparate systems, resulting in predictive information that gives insight into the capability of the infrastructure to meet business demands.
In the future, Water Corporation plans to take this a step further, working with OSIsoft to add system capabilities that proactively notify users — a big step, which will eliminate the requirement for constant monitoring.
System Value
In addition to the projects already underway, Water Corporation is relying on the scalability and flexibility of the PI System infrastructure as their one-stop shop for data collection and advanced analysis, in line with the organization’s growing needs. Additional applications include:
For the Water Corporation, the PI System infrastructure will play a significant role in converting raw input data into value-added information in the form of dashboards, integrating with GIS systems, developing “one best way” analysis techniques and long-term performance metrics.
With OSIsoft’s iViews, the utility can integrate real-time information into SAP and laboratory databases, visualizing information through the SAP Netweaver Portal. OSIsoft’s IT Monitor can leverage the PI System to monitor telecommunications hardware (routers, switches, IT hardware infrastructure), which may eventually lead to monitoring of the corporate IT network.
Lessons from Down Under
As companies leverage enterprise data historians to improve decision making in water and wastewater production, treatment, and conveyance, it is important that they have infrastructure and tools on which to standardize real-time and historical data management and analysis.
Some water utilities in the U.S. and Canada are using enterprise data historians to manage energy optimization, compliance reporting, water leakage, and operations optimization. As water scarcity and sustainability become more of an issue in North America, and as desalination initiatives gain more prevalence, the lessons and experiences from Australia will be invaluable.
About the Authors:
Gary Wong is a Global Water Industry Executive with OSIsoft. He has extensive international experience providing strategic and cost-effective enterprise business integration solutions, particularly with Engineering and IT systems in the water and wastewater industry. Ian Scott is an information team leader in asset management with the Water Corporation. He has been involved with the Water Corporation in one form or another for the last 18 years, dealing with groundwater source assessment and development, wastewater conveyance planning and IT System development. Most recently, he has focused on developing and maintaining the PI system within the Water Corporation to maximize the use of the information and providing access of the information by field personnel.
Demystifying the Enterprise Data Historian
An enterprise data historian is a central data repository for all process control information in your enterprise, encompassing all real-time and historical information (time series) collected from automation and control systems. A valuable tool for utilities, data historians turn raw process control data into actionable, consistent information, leading to improved decision making and efficient operations.
Control and automation systems can generate volumes of data — from sub-second to only on an exception-basis — but companies don’t know how much data is going to be generated (e.g.. number of values and changes in values); therefore, they cannot effectively collect all the information in relational databases.
The data historian, based on a time-series database (non-relational), allows users to collect all the relevant information they need and analyze it based on raw and aggregated values. Time-series process control data can then be leveraged with other existing enterprise or business systems, such as: ERP, CMMS, GIS mapping, LIMS or asset management.
When evaluating an off-the-shelf enterprise data historian for your organization, ensure that it provides an information infrastructure that can perform the following critical tasks, without the need for customization:
- Natively unites time-series data from a multitude of disparate control systems;
- Offers out-of-the-box data and business integration with other IT systems, such as ERP, GIS, CMMS and LIMS for real-time performance management;
- Scales to hundreds of thousands of data points on a single server;
- Retrieves and displays tens of thousands of data points within seconds;
- Aggregates raw data (up to sub-second level) to minute, hourly and daily averages instantaneously;
- Feeds information and trends to a Web portal and links with business intelligence decision-support tools;
- Provides an asset-centric view and relationship of assets with name aliasing;
- Stores and displays data that is fully auditable and secure, allowing only the right people access to the information;
- Delivers High Availability data uptime;
- Vendor provides 24 x 7 customer support.


