Depth Measurement is Key to Usefulness of Flow Data
Sorting through the nearly identical performance claims by manufacturers of open channel flow monitors is both challenging and puzzling. A buyer today who conducts a quick review of accuracy specifications for flow monitors will find that the self-stated accuracies are almost the same for all manufacturers.
Conventional wisdom suggests that meter sensor technology and monitor accuracy should be the key features that drive a purchase decision. However, marketing campaigns for flow monitors are based on other features intended to appeal to buyers, such as access to data over the Internet, satellite data collection, or direct measurement of average velocity. In these marketing strategies the measuring technology itself has become a secondary issue and many buyers don’t know the nuts and bolts of flow monitoring technology. Flow monitors should be selected first by the depth technology, second by the velocity technology and third by a combination of software, battery life, reliability and other issues that relate to your specific application.
The EPA has responded to the difficulty faced by sewer agencies as they try to sort through the performance claims by manufacturers of environmental equipment. Several years ago EPA developed the Environmental Technology Verification Program to verify performance of several types of air and water related equipment including flow meters. See http://www.epa.gov/etv/verifications/verification-index.html.
To date, few monitor manufacturers in the flow measurement business have submitted their monitors for testing. Until the manufacturers all agree to submit their equipment to a common method of verification, such as the EPA’s ETV Program, most consumers will have to depend on their own experience or the experience of their peers to distinguish between the different technologies.
There are only two depth of flow technologies that are in practical use today, Pressure transducers and Ultrasonic sensors. Velocity sensors fall into four different categories as discussed below.
Pressure transducers are simple strain gauges with the “strain” coming from water pressure pushing on a membrane. An air tube offsets the effect of changing air pressure. Pressure sensors are commonly found on the least costly flow meters and they are simple to operate. Two weaknesses of pressure transducers are that 1) the air tube must be protected with a desiccant to prevent moisture from entering the tube and destroying the strain gauge and 2) the sensor is subject to drift.
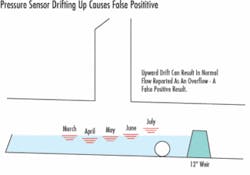
All pressure transducers are subject to drift, with the most expensive sensors exhibiting the least drift. Pressure sensor drift is tolerable to agencies that are interested in only a rough idea of how flows vary over time. Drift is intolerable in applications where absolute values are needed such as billing, I/I calculations, and modeling.
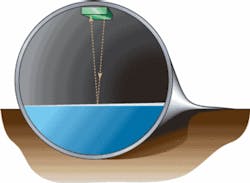
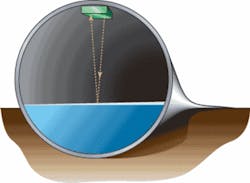
Ultrasonic depth sensors are timing devices that measure the time for an ultrasonic “pulse” to return back to the sensor after reflecting off the water surface. These devices are generally not subject to drift and measure with greater precision than pressure transducers. They are more costly and appear on the more expensive, and more accurate, flow meters. Agencies who measure flows in order to bill satellite agencies almost exclusively use ultrasonic measurement either in flumes or area-velocity meters.
All but one manufacturer uses a “down looker” mounted at the top of the pipe to measure the time for the pulse to travel down and back. The “up looker” is mounted in the flow at the bottom of the pipe and the signal reflects off the surface. It is important that these sensors are mounted level such that the signal travels vertically.
The measurement “dead band” is a weakness if a single transducer is used to both transmit and listen for the return echo. The time required for a single transducer to switch from transmit to listening mode prevents a measurement in the dead zone, which can be up to 18 inches. To address this issue, ADS has developed the quad-redundant sensor, which uses four transducers. This increases reliability and reduces the dead zone to ½ inch.
The greatest discriminator among flow monitors, in terms of accuracy and reliability, is the method for measuring depth. The specification sheet for the both ultrasonic and pressure sensors on the market today all claim to be accurate to within a fraction of an inch. However, pressure sensor drift interferes with long-term reliability of pressure sensor data.
Drift commonly ranges from 1 to 6 inches, but can often exceed 36 inches if uncorrected. Drift can occur in a single day or over a month. Flow monitoring service providers using pressure sensors must budget for weekly visits to the site to spot and correct for drift.
There are four velocity technologies in use by the six major manufacturers. 1) electromagnetic, 2) continuous wave Doppler, 3) gated Doppler, and 4) time of transit. All of these technologies rely on the Continuity Equation which requires that the average velocity be known. This is very difficult to do because of the velocity profile of moving water. The velocity near the pipe wall is lower than at the center and the velocity profile can vary widely from pipe to pipe. Manufacturers each employ different methods and algorithms to convert velocities sensed by their technologies into a calculated average velocity, but the method is seldom included in specifications.
Choosing which technology is right for your agency can be difficult and there is little objective information available to assist in the selection. There are several issues that a user should consider when selecting a flow meter including: the size of pipe to be measured; the minimum depth of flow in the pipe; whether the pipe surcharges or not; the uniformity of flow in the pipe; required meter uptime; required accuracy of measurement; and frequency of battery replacement. The chart below provides some helpful information in evaluating the different technologies and manufacturers. This chart contains information from the manufacturers as well as subjective information obtained from users.
Every technology is designed around the assumption that uniform flow will exist at the metering site. Uniform flow means that the depth of flow, the velocity of flow and the direction of flow will be constant at least through the section of pipe where the meter is located. For that reason nearly all flow meters are installed on the incoming line to a manhole to measure in the most uniform flow possible. Flow passing though a manhole is normally disturbed, making measurement in the manhole channel a risky undertaking. In deeper or surcharged flows, the depth-velocity relationship in a manhole has little relationship to that in the pipe.
Fortunately, there is a simple two-step process that can be used to help sort through the manufacturer’s claims. This method is described in detail in the paper Peeling the Onion of Meter Accuracy published in the WEFTEC 2001 proceedings. Copies of this paper can be obtained by contacting Patrick Stevens at 256-430-3366 or at www.adsenv.com/peeling.
Peak Velocity Doppler technology is the only wastewater measuring technology that is verified by the ETV Program and the only one that is successful with measurements in a wide range of flow rates and pipe sizes including both low flow and large pipes. Some manufacturers promote their technology as being best in large diameter pipes, but the true test of which meter technology could be appropriate is based on a combination of pipe size and the range of flow depths expected.
Technologies that are marketed for large diameter pipes (greater than 48") may not perform well when depths are low. This can be a problem in sanitary sewers where dry day flows are less than 30% of pipe height, but is especially an issue in combined sewers where the average depth of flow can be 5% to 10% of pipe height.
Regardless of the meter used, the scattergraph is the true test of whether the meter recorded hydraulically valid data. Information on scattergraphs and a scattergraph poster can be obtained from the ADS Environmental Services website at www.adsenv.com/scattergraphs. You can also visit the ADS website for more information on flow monitoring technologies: www.adsenv.com.
About the Author:
Patrick Stevens is Vice President of Engineering at ADS Environmental Services. He has 13 years of experience with ADS and over 30 years of professional experience in the field of collection systems engineering. Stevens has worked with numerous cities and engineering consultants to develop and deliver innovative flow monitoring programs for design, modeling, and rehabilitation of sanitary and combined sewers. He holds a B.S. in Aeronautical Engineering and an M.S. in Environmental Engineering from Purdue University.


