New Monitor Makes Sense of Water Quality Data
Water systems with remote water quality sensors installed throughout the distribution network for real-time system surveillance are collecting large quantities of data that can be difficult and time consuming to analyze. Now, intelligent software integrates the data from remote sensors and calculates a trigger signal indicating water quality changes in the distribution system.

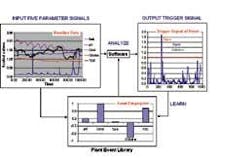
With the new Event Monitor™ Trigger System from Hach Company, operators can label the specific sensor measurements – the 'fingerprints' – related to systemic situations such as equipment failure and pre-nitrification. The Event Monitor system stores these fingerprints in a 'Plant Event Library,' then alerts with a single trigger signal when it recognizes water quality fingerprints signaling an operational upset.
Operators know that the living and breathing water system normally exhibits variation in source water quality, distribution system residence time, and disinfectant concentration from season to season, day to day, and even morning to night. Perhaps over a period of years, an operator might develop the intuition to know which changes in water quality measurements might be expected for their particular system.
For example, the experienced treatment operator might come to recognize what changes in source water turbidity, pH, and conductivity are indicative of a natural change in a particular area of the watershed. The operator might recognize what changes in chlorine residual in a system water tank are simply due to residence time or temperature changes and do not reflect a nitrification event.
"Unfortunately," acknowledges Terry Engelhardt, Hach Municipal Water Treatment Specialist, "such intuitive knowledge takes seasons and years to develop, even with a static system that isn't growing in size and demand. Debilitation of an aging infrastructure, system expansion using different piping materials, and dabbling with new disinfectants complicates interpretation of water quality changes.

"While treatment plant operators have 10, 20, or more years relating on-line monitoring data to the water treatment process, they're not so familiar with continuous monitoring of finished water in the distribution system. Nor can the industry afford the decades it would take for operations personnel to gain the intuition that can spot water quality changes caused by contamination. Operators need help to decipher what all the distribution monitoring data mean. They need to ferret out the abnormal data – the ones that flag an operational upset – from the reams and reams of data that can be generated by real-time remote system monitoring."
The Event Monitor Trigger System, introduced by Hach at the American Water Works Association (AWWA) Conference and Exhibition in June in Orlando, provides such insight to the relationships among various analytical measurements.
Its software is designed to analyze turbidity, chlorine, pH, conductivity, and total organic carbon (TOC) measurements made by the company's Water Distribution Monitoring Panel or the PipeSonde™ In-Pipe Probe and astroTOC UV On-line TOC Analyzer. Chlorine measurement serves to detect the presence of oxidizing or reducing agents; pH defines acid/base relationships; conductivity reflects ionized species present; turbidity provides indication of undissolved particulate matter; and TOC measures total organic carbon present.
The five sensor signals collected by the Event Monitor yield a geometric representation of the water system quality at any time. The system software applies mathematical analysis of all parameter measurements to recognize data patterns and deviations.
Using the system's touch-screen display housed in a stainless steel enclosure, operators easily capture the value of all five measurements – the fingerprint – caused by a transient event such as flushing, change in source water, or equipment failure. As a proactive tool, the Event Monitor system with this "learning" ability helps the utility establish a normal profile of the water system while building a thorough knowledge base relating measurements with time, season, demand, or other system variables.
More than a documentation system, the Event Monitor also includes a Trigger Algorithm that calculates a real-time Trigger Signal and associated operator alarm when conditions in the water depart from normal, or baseline, values. A Classification Algorithm automatically compares baseline-deviation measurements against the "Plant Event Library" of system-specific events learned and catalogued since installation at the monitoring site. The software automatically reports the identified plant event or catalogs the new fingerprint in the plant library database to be identified by attending personnel. It also can be set to trigger an autosampler in the event of an alarm and communicate to a PLC or SCADA.
Tests using substances – such as sewage and agricultural chemicals – in large flow loops simulating real distribution systems have demonstrated the ability of the Event Monitor system to detect contamination. The system also exhibits the ability to differentiate deviations in water quality due to operational fluctuations in actual water distribution systems. Fingerprints saved at one Event Monitor location may be downloaded to update monitors located at other sites within the network.