Using Process Data to Improve Plant Performance
By D. Kelly O'Day and John D'Aoust
The water treatment plant in Haverhill, MA, collects extensive process data: detailed Supervisory Control and Data Acquisition (SCADA) system data and manually recorded operator data on flow, raw water quality, chemical feed, turbidity and finished water quality data.
To convert this raw data into useful process information, Haverhill automated the manual operator data collection effort. Operators now enter their process data into a process data management system that provides process performance reports and charts that are used to routinely assess process performance. In addition to making better use of process data, Haverhill reevaluated the process data collection program and reduced data collection by 25 percent, saving operator time that can now be used on more important critical process issues.
The coagulation process and chemical pump delivery are examples of how Haverhill is using this data to improve plant performance.
Coagulation Process Improvement
Haverhill uses alum as the primary coagulant. Operational experience over the years provided guidelines for seasonally setting the alum dose as water temperature and quality changed. Operators used the settled water turbidity as an indicator of coagulation process performance. From experience, operators knew that settled water turbidity increased in the colder waters of late fall.
One of the first uses of the process data management system was to evaluate the coagulation process to see if the cold water settled water turbidity could be improved.
The plant collects temperature, raw water turbidity, and settled water turbidity and pH as well as alum dose every four hours. Once the process data was organized in a database, it could be statistically analyzed to better understand the temperature-pH-alum dose-settled water turbidity relationship.
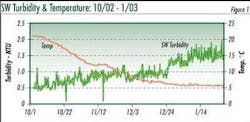
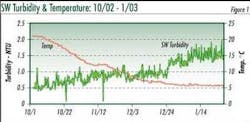
Microsoft Excel was used analyze the coagulation process data. Figure 1 shows the settled water turbidity and water temperature trends in the October 2002 – January, 2003 period.
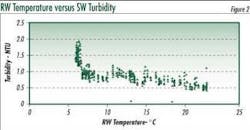
Figure 2 shows the same raw water temperature and settled water turbidity data in a scatter chart. The settled water turbidity decreases as the temperature increases, the same as trend shown in Figure 1.
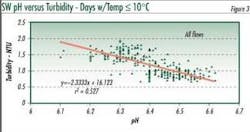
Figure 3 shows a scatter chart of the settled water pH and turbidity data for the period when the water temperature was less than 10 degrees C. This scatter chart also shows a regression line that estimates the settled water turbidity based on just the settled water pH. The coefficient of determination (r2) of 0.526 shows that pH plays a major role in determining the settled water turbidity. Plant staff knew that pH was an important process control parameter; this analysis indicated that increasing the settled water pH to 6.7-7.0 could improve the coagulation process in cold-water conditions.
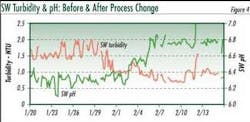
Jar tests confirmed the process data analysis. Based on the pH – turbidity relationship and jar tests, the plant adjusted the target pH and immediately saw a significant reduction in settled water turbidity, as shown in Figure 4. As the pH was increased on February 1, the settled water turbidity began to decrease as predicted by the coagulation process data analysis and jar tests.
Valuable information on the relationships between water temperature – pH – alum dose - settled water turbidity was hidden in the raw data. Analysis of the process data helped to clarify these important process relationships.
Based on the increased understanding of the role of pH in alum coagulation, the plant was able to adjust coagulation pH and reduce the annual average alum dose by 15%, providing a significant cost savings.
Chemical Pump Delivery
Haverhill uses six water treatment chemicals: alum, caustic soda, sodium hypochlorite, zinc ortho phosphate (ZOP), potassium permanganate, and fluoride. Chemical feed pump accuracy and reliability are critical from both process control and cost control standpoint. Chemical costs are the third highest budget item, after labor and electricity.
Overdosing of alum, as an example, may waste chemical; under-dosing may reduce coagulation effectiveness. For caustic soda, chlorine, ZOP and fluoride addition, operators monitor the downstream pH/ chemical residual and adjust the chemical pump stroke to bring the chemical delivery in line with the target concentrations. This is not practical for alum and potassium permanganate feed control.
Chemical feed system calibration columns can be used to test chemical pump output. There are two uses of chemical feed pump calibration testing: 1) confirm that pump speed – stroke setting is delivering the target dose, or 2) evaluate pump output consistency over time. Haverhill wanted a simple pump test that could both confirm actual chemical delivery dose and spot potential changes in pump output to prevent process upsets caused by failures before they occur.
In June 2003, Haverhill started to regularly calibrate the 10 chemical feed pumps and track chemical pump output. With this effort, Haverhill has prevented at least four process upsets in the past year by finding pump problems before they caused a process upset. A process upset, caused by an alum pump failure, for example, can take 12-18 hours to recover. Preventing this type of process upset is well worth the effort.
It now takes two operators a total of 30 minutes to calibrate the 10 pumps. The operators record the test date, pump identification, drawdown volume and drawdown time. This data is entered into an Excel spreadsheet that calculates the drawdown in ml/second, the equivalent gallons per minute feed rate and based on plant flow rate and chemical density (pounds/gallon) the actual applied dose in mg/l. If the applied dose is significantly off target, the operators can adjust the stroke to increase/decrease the chemical delivery to the target dose.
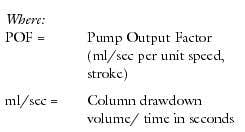
In addition to confirming actual doses, Haverhill wanted to track potential changes in each chemical pump output caused by air build-up, pump wear and tear or other factors. To track potential pump deterioration over time, Haverhill calculated a Pump Output Factor (POF) using Equation 1 below:
Pump speed = Pump speed at time of test
Pump stroke = Stroke setting at time of test
The pump output factor normalizes the pump test ml/second results to a unit speed and stroke condition so that each pumps output trend can be tracked over time.
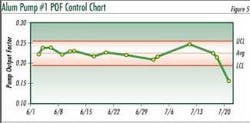
The POF data can then be control-charted to determine whether the pump is in statistical control. Figure 5 shows a control chart for alum pump number 1 in the 6/1/03 – 7/20/03 period. The control chart shows that the pump went out of statistical control on July 20. Based on the drop in the POF, the pump was taken out of service, preventing a coagulation process upset.
Using Excel, POF control charts are produced automatically, allowing the operator to quickly see how the pump is performing and to take steps if the pump is out of statistical control.
Haverhill has taken several other steps to improve process performance:
1. Developed a jar test data base and modified jar test procedures to test for optimum pH at target alum dose
2. Conducted flocculator velocity gradient tests that showed initial mixing issues. By increasing flocculator speeds, they improved overall mixing and noticeably improved settled water color.
About the Authors:
Kelly O'Day is a Vice President with Woodard & Curran, Dedham, Mass, who specializes in helping water and wastewater treatment plants optimize operations. He can be contacted at (781) 251-0200 or via [email protected]. John D'Aoust is Plant Manager of the Haverhill facility.
