Analysis System Offers Better Returns on Main Replacement Dollars
By Jeffery Frey
In today’s economic climate, utilities are looking harder than ever for ways to cut costs and to spend their money in the most cost-effective manner possible. This includes making wise decisions when it comes to upgrading and replacing aging infrastructure. In particular, water main rehabilitation and replacement for many utilities requires a significant annual expenditure and is an area where utilities can make better planning decisions.
Asset management programs often include a comprehensive effort to assess the condition of water and sewer mains, gathering and organizing data on break history, pipe age, pipe material, year of construction, location, soil type and pressure. The idea is to use this information to determine the likelihood of failure for a given pipe or group of similar pipes. The data may be fed into a formal predictive model to determine likelihood of failure, or simply analyzed by utility staff and organized into a list of pipes most likely to fail in the near-term.
New software on the market today allows utilities to assess the state of their water piping networks without have to collect large amounts of asset management data. Instead, utilities can get started immediately by running a consequence of failure analysis using their current system hydraulic model. The results will provide significant value in spending mains R&R dollars wisely.
Two Components of Risk
As taught in workshops on asset management, there are two components to the risk equation: Risk = Likelihood of failure x Consequence of failure. The likelihood (or probability) of failure component is the more difficult of the two risk components to accurately assess. The consequence of failure component of risk is actually easier to assess–and is arguably more important than likelihood of failure.
To be clear let’s examine how these two components relate to risk. First consider a pipe that has suffered many breaks but is quick and inexpensive to repair. It would be considered low risk since its consequence of failure is minimal. Next consider another pipe that by every measure appears to be in good condition with a low likelihood of failure. However, if it does fail catastrophically there will be a great impact, possibly including full coverage on both the morning and evening news. This second pipe should likely be assigned a higher risk value than the first. The aim of the water utility will generally be to replace its highest risk pipes first using its available dollars.
Planning Analysis
Utilities would prefer not to wait for every bit of data to be collected and analyzed before finalizing their annual main rehabilitation and replacement plan and budget. They need to move ahead making the best decisions possible given the data available. The quickest and most cost-effective way to proceed would be to run a consequence of failure analysis and integrate the available likelihood of failure information, if any. If there is no reliable likelihood of failure information available, the consequence of failure analysis using pipe criticality software can still provide highly valuable results.
A consequence of failure analysis is run using the utility’s hydraulic model, which might be a system-wide, all-pipes or skeletal model or several zone or district models. The idea is to break each pipe (or a selection of pipes) in the model one by one and then record the consequences of the break in terms of expected flow from the break, flow velocities and pressures, flows delivered at demand nodes, critical and key customers impacted (hospitals, schools, dialysis users, large industrial plants), and more.
If there are valve data available in the utility’s GIS or even just valve coordinate data, the shut-off valves can next be inserted into the model to enable a similar hydraulic consequences analysis for all pipe breaks under a break-isolated condition. Additional key information can be collected such as the minimum number and specific selection of valves required to isolate the break and the volume of water isolated in the pipes which must be dewatered before repairs can begin. Flows, pressures and critical customers impacted in some cases will be quite different in the break-isolated case as compared to the pipe break case.
Better Maintenance Decisions
The pipe criticality analysis targeting consequence of failure quickly identifies each individual pipe that would have a large negative impact on the system if it should fail. Pipe condition and likelihood of failure can be ignored for the time being and the analysis will still provide significant value.
Added value can be attained by using the consequence of failure analysis results to inform the decisions being made by the utility’s Maintenance group with regard to valve maintenance and pipe flushing. If the analysis shows that certain pipes, if they were to burst, would require say 12 valves to be shut in order to isolate the break, then crews could be sent to confirm that those valves are all operable. (A decision might also be made to install another shut-off valve in the area.)
If the analysis shows that certain pipes exhibit very high velocities when even distant pipes break, then these pipes could be regularly flushed to ensure they don’t become the source of discolored water being delivered to customers following a future break. Finally, condition assessments could be prioritized to ensure those pipes that exhibit a high consequence of failure are inspected relatively soon.
Real-Time Incident Management
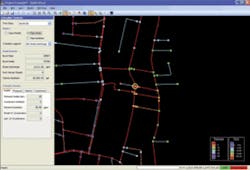
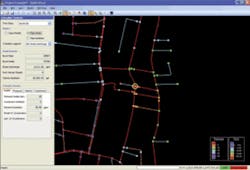
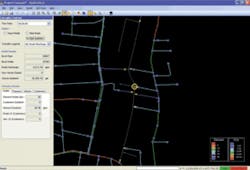
The investment of time and money into the pipe criticality software and system setup can also provide value to the utility’s Operations group. With the software installed on a laptop computer, Operations staff can respond more quickly and effectively when there is a reported pipe break. The user simply clicks on the reported pipe on the network map shown on the screen and immediately can see the predicted hydraulic response of the system. Another click identifies the minimum set of valves required to isolate the break. If the Operations crew finds in the field that one of the valves is inoperable, the user can specify that valve as inoperable and the software will identify the next valve(s) needed to isolate the break.
Developing a Risk Ranking
The consequence of failure analysis described above is an immediate first step that utilities can undertake using their existing hydraulic model and valve location data, if any. To develop a complete risk assessment and risk ranking to inform a utility’s main rehabilitation and replacement plan, the component of likelihood of failure needs to be introduced into the analysis. Recognizing that this is the more difficult half of the risk equation to evaluate, a utility can still begin their analysis without needing to collect every bit of pipe data possible before getting started.
A good start could be made by assigning a relative likelihood of failure score for any pipes that are known to be in very poor or very good condition. Next, the utility could perform a condition assessment on the highest consequence of failure pipes identified and assign a likelihood of failure score. These likelihood scores could then be paired with scores developed from the consequence of failure analysis to come up with a risk score. At a minimum, these pipes with risk scores could be ranked and compared with the utility’s current main R&R plan pipe list to see if adjustments should be made to the R&R plan. As more pipe data become available and the risk assessment is extended, the R&R plan can be further updated.
Optimized Planning
Utility planners should recognize that simply replacing aging pipes with pipe of the same size or a new minimum pipe size does not represent the most cost-effective approach to upgrading a water distribution system. The ultimate step in main R&R planning is to run an optimization analysis that considers several options for each pipe designated for repair or replacement in the main R&R plan.
The optimization can choose rehabilitating the existing pipes (using any number of preferred technologies), replacing the existing pipe with pipe of an optimal size, abandoning the pipe, or adding a new pipe along a more favorable route. In optimizing these choices, the utility can very effectively upgrade its system hydraulic performance and redundancy as it spends its dedicated annual R&R budget. (An example of this optimization approach is described in the award-winning August 2003 AWWA Journal article by Wilson et al, Cost Savings and Enhanced Reliability for Main Rehabilitation and Replacement.)
Conclusion
This article describes how utilities can readily proceed to undertake a pipe criticality analysis based on their system hydraulic model and basic valve location data. The analysis can often be completed in a matter of weeks paying big dividends by helping the utility maximize its return on main replacement spending, as well as by providing critical information to the utility’s Maintenance and Operations groups.
Optimatics has recently introduced its OptiCritical™ pipe criticality software to water utilities in the US following two years experience in consulting, licensing and training utility staff in Australia and the UK. The experiences and feedback from Gold Coast Water, South East Water, SA Water, United Utilities Water, Three Valleys Water and others have been extremely positive. WW
About the Author:
Jeffery Frey, P.E. is President of Optimatics North America based in Chicago. Frey has worked in the specialty area of water and wastewater systems optimization since 1996. He may be contacted at [email protected].


