Water Audit Helps Identify Non-Revenue Water Losses
By Luis Mijares
All potable water systems have some amount of water that is produced but not sold; this is commonly referred to as "Non-Revenue Water" (NRW). The average amount of NRW for utilities throughout the nation is about 22%. A well run utility will keep this figure in the low teens while utilities with older infrastructure, lacking routine leak detection and meter testing programs, may approach 40% or higher.
Non Revenue Water is comprised of both real and apparent losses. Real losses consist of volumes of water lost through all types of leaks, bursts and overflows of mains, service connections, and reservoirs. Apparent losses are those due to unauthorized consumption, illegal taps, and meter reading and billing errors. By reducing real losses a utility can lower the overall production costs for water and help preserve high levels of water quality. By reducing apparent losses, the utility can increase billing revenue without raising rates.
As an example, take an average size city with a population of 370,000 and 105,000 water customers with a daily water production of 49 mgd and 15% NRW. Let's use $3/1000 gallons for retail water sales and a cost of $275 per million gallons produced and pumped.
At the lower end, assuming the NRW is comprised of 10% apparent and 90% real losses, this 15% NRW is costing the city $1,469,000 per year. At the higher end, assuming 90% apparent and 10% real losses, the 15% NRW is costing them $7,317,200 per year. Now add sewer to that at $5/1000 gallons and the loss or potential recovery is between $2,146,200 and $19,315,800. Even if you could only find and correct 50% of the 15% water loss, you would be saving between $1,073,100 and $9,657,900 per year.
The key to recovering this money is reducing losses that increase production and pumping costs, require extra plant capacities and more raw water needed and then accurately bill what is really being used by all consumers. Lower costs and increased revenues translates into larger working funds for the utility.
Is there a way to efficiently use presently available funds to find and fix real and apparent losses? Generally speaking 80% of the losses will occur in 20% of the system. The challenge is identifying the 20% that needs attention and focus the investment.
A common misconception is that the majority of losses can be found in the oldest parts of the distribution system. But how many times have we seen old pipe performing better than new pipe? One can chart breakages and prioritize line replacements in that fashion, however the number of those breaks or leaks that come to the surface is also much more dependent on depth, soil conditions, pipe materials, pipe installation technique, pressure, and weather. In other words, there are too many variables.
Water Audit
The most efficient way to find and address real and apparent losses is through a comprehensive Water Audit of the system, not just a paper exercise but actually verifying the accuracy of the numbers with field work. The major goal of a Water Audit is to get an accurate quantity for NRW. In order to do this the amount of water produced or purchased has to be accurately determined by testing the accuracy of the master meters over the flow regime for which they are being used.
These large meters are often Venturi type meters that require specialized testing techniques. A common fallacy is that the electronics of a Venturi can be tested and the meter deemed accurate. However, over the years mineral and debris deposits affect the diameter of the cone and pressure port openings and the physics of the meter change as well. It is best to test the whole meter and not just the electronics to get meaningful results.
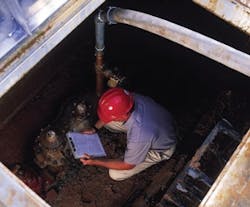
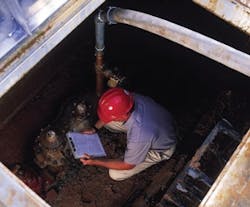
As an example, ADS Environmental Services uses the complete flow method with a Pitometer, an instrument that has been documented accurate to +- 5% by independent labs. The Pitometer is inserted into the meter calibration port or a 1" tap before or after the meter and is used to record flows that are going through the subject meter. These measurements are compared to the actual meter readings and their SCADA output, both of which can introduce error. If error is found, a corrected output for the meter will then be used for the production value side of the audit and the meter/SCADA output is calibrated.
The other side of the NRW equation is the water quantity that is being billed or can otherwise be accounted for. A paper audit of the billing system will show what is being billed. Special attention has to be given to large meter trends as these usually record the largest amount of water consumed or sold.
Authorized but unbilled uses of water are accounted for by estimating un-metered use like fire service, irrigation for parks, public buildings, hydrant flushing programs, etc. The difference between water produced and water billed, or otherwise accounted for, is Non Revenue Water.
Real and Apparent Losses
At this point the utility has an accurate NRW percentage and volume for their system and realistic reduction goals can be set. To achieve those goals, NRW has to be broken down into real and apparent losses as they require slightly different approaches.
The methodology used by ADS has been derived from the inception of the Pitometer Water Waste Survey first developed by Edward S. Cole in 1895. The approach consists of dividing the water distribution system temporarily into a series of isolated flow loops or "districts" within existing pressure zones. Districts are formed as valves on mains are opened or closed to let appropriate volumes of water into a distribution loop from an adjacent loop. Valves are also used to control the exit of unused water into the next adjacent loop while supplying adequate service and pressure to the loop's users including the provision for fire service.
A Pitometer is installed into the main lines near the entrance or exit valves and flows are recorded for water entering and leaving the district for periods of 24 to 72 hours. Generally flow measurements span weekdays and weekend days as consumption patterns are different. These daily flow amounts are then used to derive monthly flow totals for the district.
The district's recorded flows over a period of time are compared to billing records to determine the NRW for that district. Districts can then be ranked in order of importance with the greatest losses by type; real or apparent and efficiently targeted for leak detection or meter testing.
Measurements made in the very early hours of the morning when consumption should be non-existent, or at its lowest, can be used to determine where leakage is occurring (real losses).
District measurements are also used to check metering and billing accuracy and unauthorized water usage. By comparing net flows measured against billing for meters within the district over the same time span overall accuracy can be verified and the need for large meter testing, sizing analysis or residential sample meter testing in that District can be determined. The process continues and nearly funds itself until NRW is reduced to an economically acceptable level.
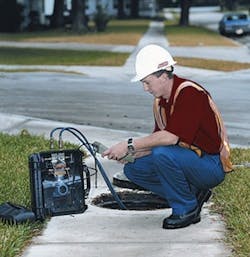
Leak detection technician using an acoustic correlator to isolate leaks.
Targeting the worst districts first not only helps the utility get the biggest return on their investment quickly, but as lost production is reduced and billing is increased, more funds become available for further diagnostics and rehabilitation of lower ranked districts.
Collection System Infrastructure
There is also a less obvious but large potential revenue source for combined water and wastewater utilities. By increasing water billing, sewer billing also increases and that should also be figured into the return on investment calculation. Normally utilities bill for sewer based on some portion of water consumption. An increase in billable water consumption generally results in a two, three or more fold increase in sewer billing, depending on the utility's rate structure. This new found revenue source for the sewer side can be used for diagnostics and rehabilitation of collection system infrastructure to improve service, water quality, and mitigate regulatory risk without rate increases.
Engineer performing a District Flow Measurement with a Pitometer Flow System.
Conclusion
While funds generated and costs reduced by these methods may not completely fill the gap in spending needed, it will go a long way toward generating funds to maintain and improve water and wastewater infrastructure. It is a way of generating much needed funding for projects without raising rates, applying for loans, or issuing bonds. All this can be done under the control of the utility manager using a structured program to fit the needs of the utility without regulatory agency oversight and political scrutiny. WW
About the Author:Luis Mijares is Water Services Development Manager at ADS Environmental Services, a Division of ADS LLC. Mijares has over 33 years of professional experience in operations, business development, and engineering roles, 12 of that with ADS. For more information on Water Audits, leak detection and other water services offered by the Pitometer Group of ADS, visit www.adsenv.com/waterservices.
More WaterWorld Current Issue Articles
More WaterWorld Archives Issue Articles


