Modeling, GIS Software Optimizes Water Main Cleaning By Paul F. Boulos
by Paul F. Boulos
Maintaining the hydraulic and water quality integrity of drinking water distribution systems is a key concern for all water utilities. The hydraulic carrying capacity of water mains deteriorates with age, proportionate to the corrosive nature of the water and surrounding soils. Precipitation, microbiological activity and corrosion can all form deposits on the pipe walls.
These accumulations increase the mains’ hydraulic roughness and reduce their cross-sectional area and hydraulic carrying capacity, which can lead to undesirable low pressures and inability to deliver fire flows, especially during high demand periods. Slow-moving water can also lose chlorine residuals at stagnant spots, creating a public health risk. Problems associated with water quality degradation are particularly acute in dead-end lines and low-demand portions of water distribution systems.
Flushing the water mains is an effective way to maintain water quality and system capacity. The procedure can improve water quality by restoring the disinfectant residual, reducing bacterial regrowth, dislodging biofilms, removing sediments and deposits, controlling corrosion, restoring flows and pressures (and overall system capacity), eliminating taste and odor problems, and reducing disinfectant demand throughout the system. These benefits prolong the life expectancy of the distribution system and reduce the potential for waterborne disease outbreaks.
Unidirectional Flushing
There are three general flushing methods (conventional, unidirectional, and continuous blow-off), but unidirectional flushing (UDF) is the most effective, resulting in both hydraulic and water quality improvements (Oberoi, 1994; Boulos et al., 2006; NRC, 2006).
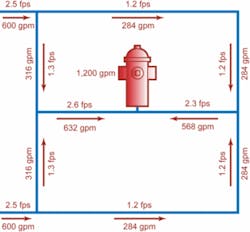
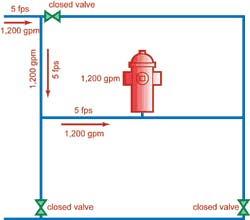
In this process, valves are closed and hydrants opened to create a one-way flow that removes built-up sediment in the water mains. This high-speed flushing (typically greater than or equal to 5 ft/sec) maximizes shear velocity near the pipe wall, producing a scouring action that effectively removes sediment deposits and biofilm. Although it is more costly and time consuming (requiring more planning) than conventional flushing, unidirectional flushing is more effective and requires about 40% less water. In addition, because unidirectional flushing tests almost all of the water system’s valves and hydrants, it helps to identify those in need of repair or replacement. It can also reveal other distribution system problems, such as leaks and breaks.
Flushing should start at a clean water source (e.g., pump station) and proceed outward through the system so that flushing water is drawn from previously flushed reaches. This step-wise approach ensures that the mains are always being flushed with clean water, systematically washing out the pipes without pulling contaminants from other lines the way conventional flushing can.
Optimizing Flushing
UDF can be optimized through the use of hydraulic and water quality modeling and geographic information systems (GIS). The GIS is used to identify flushing zones, customer complaint locations, and the locations of valves, hydrants, pump stations, pressure-reducing valves, and other pertinent facilities. The hydraulic model is used to estimate pipe flow rates (magnitude and direction), velocities and flushing times. It also assesses the hydraulic impact of flushing sequences - information needed to avoid excessive pressure drops (e.g., below 20 psi) throughout the system while providing sufficient flushing velocity to scour solids from the pipes.
The water quality model is especially useful for pointing out locations in the system that show excessive water age (i.e., long detention time). This combination gives utilities a visual tool to efficiently manage both water quantity and quality and distribution system assets such as pipes, hydrants and valves.
Flushing Software
InfoWater UDF, a new product from MWH Soft (Broomfield, CO), seamlessly integrates advanced network trace algorithms and dynamic water network (hydraulic and water quality) modeling with the latest generation of GIS technology. Built atop ArcGIS from ESRI (Redlands, CA), the application capitalizes on the intelligence and versatility of GIS geodatabase architecture to help water utilities develop optimal flushing routes, flushing logistics, and sequence of flushing zones; identify which fire hydrants and water main valves should be manipulated for proper cleaning; maintain the desired level of hydraulic performance in the system; and minimize labor and water usage.
The program accurately considers the temporal variation in flow velocity magnitude and direction due to changes in demands, tank levels and pump operating conditions. It also computes minimum flushing time, total flushing volume and pipe length, flushing velocity of every pipe in the sequence, and available fire flow at the targeted minimum residual pressure. The hydraulic impact of each flushing sequence is also monitored to ensure that the desired minimum pressure is maintained throughout the system. Other advances include sophisticated statistical reporting capability, fully automated valve and hydrant operations, and flush sequence animation.
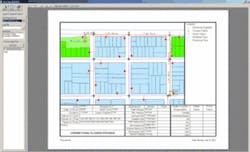
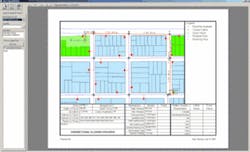
The product’s comprehensive field journal (or flush book) contains all the information a water utility needs to implement a unidirectional flushing program for maximum cleaning with optimal cost savings. A detailed series of graphical maps and technical data sheets show the fire hydrants and valves that must be manipulated for systematic, unidirectional cleaning of each flushing zone and flush sequence analyzed. The field journal also reports important information such as pressure and flow, flushing volume and duration, and water quality.
Conclusion
InfoWater UDF can be an essential part of a good overall maintenance program, helping water utilities improve their distribution system’s reliability, water quality and hydraulic capacity; assess system maintenance needs; meet regulatory requirements; reduce customer complaints; increase water savings; and sustain safer, more reliable drinking water supply infrastructures. This invaluable planning and monitoring tool can be used in many ways to develop, optimize and execute a distribution system flushing program. It has already been successfully applied by many progressive water utilities throughout the United States and Canada, producing noticeable improvements in flushing effectiveness and efficiency (Mazana et al., 2006)
About the Author:
Paul F. Boulos is the President and COO of MWH Soft (Broomfield, CO). A world-leading expert in water and wastewater engineering, Dr. Boulos has written over 200 articles and seven authoritative books, and has received a range of awards from the American Society of Civil Engineers, the American Water Works Association, and the US Environmental Protection Agency. He received his BS, MS and Ph.D in civil engineering from the University of Kentucky and his MBA from Harvard. He can be reached via e-mail at [email protected].


