Software Helps Utility with Long-Term Planning
Information management software has enabled the creation of long-term projections for the development of a sewer, tunnel and pumping system in Northern Kentucky. Metcalf & Eddy has used the software to model the Northern Kentucky Sanitation District as part of plans to develop a network to serve a new Western Regional wastewater treatment plant (WRTP) which is due to open in 2011. The model is also playing an important role in helping to plan for growth in the region and to ensure environmental compliance for the next 50 years.
The model, developed with InfoWorks CS software, was designed to provide decision-making tools and continues to provide a foundation for future planning. Use of software has enabled continuous evaluation of the sewer network under successive storms, ensuring much more realistic long-term projections than where events are considered individually. InfoWorks has also proved particularly useful in helping the client visualize where growth will occur and the sewer layout that needs to be adopted. Carrying out the analysis has cost less than 1% of the projected total construction costs and those involved see it as a worthwhile investment that has provided extensive information about the required network sizing and layout.
Additional capacity needed
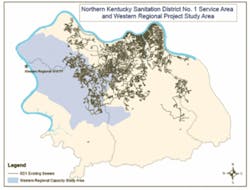
The Northern Kentucky Sanitation District No 1 (SD1) serves about 350,000 customers in Boone, Campbell and Kenton counties. The sewer system is made up of about 1,800 miles of separate and combined sewers, serving the 218 square mile area. An important application of the model is determining the sewer and tunnel infrastructure that will be needed for a new regional wastewater treatment plant being built at the far western edge of the service area.
SD1 originally started hydraulic modeling in 2001 and included extensive survey data in the models. Metcalf & Eddy converted the models from Wallingford Software’s earlier product, HydroWorks, to InfoWorks in 2004.
The district has one existing wastewater treatment plant called the Dry Creek WWTP. The hilly terrain of Northern Kentucky means that only a small portion of the system can reach the treatment plant by gravity. The capacities of the three large pump stations that supply the WWTP are exceeded in wet weather. The service area’s combined sewers will continue to pump into the existing Dry Creek WWTP, with much of the remaining flow from the separate sewers being diverted to the new Western Regional plant, which is expected to come online in about 2011.
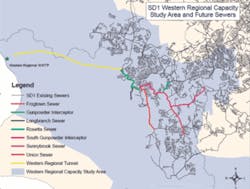
Building the new plant requires extensive investment in new infrastructure, including trunk sewers and a seven mile tunnel to the WRTP. One of the key uses has been to develop sizing for the tunnel and the associated trunk sewers to eliminate wet weather overflows within the existing system and meet the area’s needs during the decades of growth ahead.
Metcalf & Eddy and SD1 evaluated multiple scenarios for the level of service for overflow reduction and elimination with different scales of predicted development. The intention is to eliminate sanitary sewer overflows, bring combined sewer overflows into compliance, and continue to serve the area’s future growth needs, enabling SD1 to plan for growth and staged development to 2060 and beyond. This work also included addressing master planning issues, such as when future pump stations and sewers are likely to be needed.
Playing several roles
One of the project challenges was to ensure that the model can account for population growth within the service area as well as inflow and infiltration. InfoWorks has been used to generate future sub-catchments and sewers to make the model reflect reality. It has also been used to identify the areas that would need to be pumped and would be most logically served by the new treatment plant.
Another role of the project has been to examine alternative sizes for the sewers, taking into account both storage and conveyance. Continuous long-term simulations of the effects of a large variety of successive storm events have shown how the system as a whole would perform.
Exploring different scenarios
The industry’s traditional approach to long-term simulation of collection systems was to use a design storm to estimate the level of service. The new approach adopted in the District’s more recent modeling strategy has been to identify typical rainfall periods based on historical rainfall records. This involved looking at one year, five year and 10 year periods. The long-term simulations were then used to demonstrate the performance of the planned assets.
InfoWorks CS version 7.5’s ability to take advantage of the speed of dual core computer processors brought considerable reductions in run times, which allowed a variety of alternative scenarios to be explored within relatively short periods.
Inflows and infiltration
A key issue to be addressed in planning the major assets with their long service lives was how to project the future contributions of inflow and infiltration (I/I) from storm or groundwater into the system. Portions of the Northern Kentucky system were built in the 1920s and 1930s and experience I/I in wet weather, but this level of I/I would not necessarily be indicative of how more modern sewers would perform. The model was instead calibrated to reflect the performance of pipes built within the last 10 to 15 years, to produce a better estimate of I/I in sewers constructed using present-day methods.
Older areas of the district’s collection system exhibit I/I over a long response time, with long tails to storms during winter months and wet weather periods before returning to normal base flows. This led to the decision to include a very slow I/I response on new construction as a safety factor to take into account any deterioration as the pipes age. This use of somewhat conservative estimates for future areas is balanced by an assumption that I/I in existing areas would remain constant, which is not necessarily the case. The district is committed to preventing I/I in new construction, keeping the I/I projections under review, and further evaluations will ensure that the values are amended if necessary to ensure the best possible projections continue to be used.
To 2060 and beyond
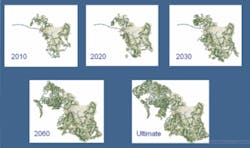
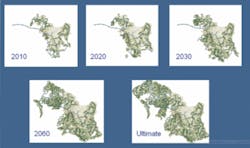
The InfoWorks model has been used to produce projections for the area for a series of development horizons at 10 to 20 year intervals from 2010 to 2060 and beyond. Projections are based on historic growth rates and planning and zoning estimates of future growth being added within the service area. The model shows how the tunnel and sewers will perform for each step in population growth, although circumstances may mean that new infrastructure such as additional treatment capacity may be needed earlier or later than predicted.
Multi-purpose modeling
The modeling program has been used in the development of both the sewers and the sub catchments. The software’s inference tools made it easy to generate a sewer based on the ground elevations at either end. The sub-catchments were developed using Thiessen polygons. An average basin size has been adopted and future basin sizes will be kept as close as possible to the values in the calibrated initial models.
Rainfall patterns
Defining the typical rainfall periods proved to be an extremely important exercise as it has a considerable impact on the definition of future levels of service, especially in the long-term simulation. Historical trends were also examined, including storm depths, peak intensities and the effect of back-to-back events. Separate consideration of the recreation and non-recreation seasons was also important in the selection of the typical periods to study. The recreation season is typically the worst period for potential water quality impacts because of low flows within the streams and rivers.
One of the ways in which the model was streamlined was to reduce the number of rainfall events that were modeled, while ensuring that all the worst cases were included. The five and 10 year rainfall periods were examined to determine the critical storm and duration for the sewers, tunnels and pump stations under consideration. This ensured that the storm event that was critical for each particular asset was included in the analysis. The greatest stress on the tunnel storage came from a storm event that occurred at the largest peak of 12 hours. Peaks between three and six hours were the most significant for the conveyance sewers. Armed with this information, further checks were carried out by running the full five and 10 year simulations.
Avoiding all overflows
An initial goal was to examine what would happen if the sewers were made sufficiently large so that they would not overflow in the 10 year period based on the development in 2060. The next step was to look at the effect of different contributions from I/I, including examining the sensitivity of the projections. Lower levels of service were also explored for cost comparison, including allowing one overflow in 2060 but none under the expected 2030 development. Further options continue to be tested within InfoWorks.
Similar exercises were carried out for the tunnel, with the level of service examined throughout the development horizon. The I/I projections influence the tunnel to a much larger extent than the sewers. Detailed studies have been required because the capital investment increases substantially if the tunnel size is made larger. Sizing has not yet been determined and Metcalf & Eddy is also working on the concept of possible phased additional storage should extreme growth occur.
InfoWorks has provided the tools to enable rapid creation of realistic long-term projections, which is enabling informed decisions to be made. The work takes account of the scale of capital investment needed, uncertainties about growth and discussions on the service levels that should be provided. Questions are still being asked about whether it is worthwhile to spend the money now on new infrastructure without being certain that the growth will occur. The model will continue to provide a foundation for future planning, with the network performance reevaluated as new developments come online.
Editor’s Note:
This article is based on a presentation given at the Wallingford Software North American User Group meeting 2007 by Eric Onderak and Clinton Cantrell of Metcalf & Eddy and Brandon Vatter of Northern Kentucky Sanitation District No. 1.


