Modeling software aids Belgrade’s water supply
By Ana Popovic
InfoWorks WS from Wallingford Software is being used in a long-term project to help improve Belgrade’s water supply. Modeling of the first of four pressure zones in the city showed areas of leakage and led to development of a solution. Pressure has now been reduced in part of the zone, while another section is being divided into sub-zones. Work is ongoing to extend the InfoWorks model to the city’s remaining pressure zones to find areas where the supply could be upgraded.
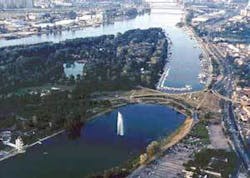
Belgrade is the capital of Serbia. It stands on two rivers, the Sava and Danube, on the Balkan Peninsula in southeast Europe. About half of the city lies between 75m and 125m above sea level and was in a single pressure zone. The remainder - which goes as high as 511m - is split into several pressure zones.
Belgrade Waterworks & Sewerage, with annual water production of 245 million cubic meters (65,000 million gallons), has a peak production of 8,000 L/s (2,100 gps) to serve a population of 1.5 million. There are 135,000 connections, five water treatment plants, 21 reservoirs, 26 pump stations and 142 wells with a total network length of 3,654km (2,270 miles). Some 15% of the pipes are over 50 years old and a further 23% are aged between 25 and 50.
Water modeling is well established in the city, with PC-based models introduced in 1985 for each pressure zone. An integrated raw water and network model was then created in 1990, succeeded by a major InfoWorks software model in 2003, covering 540 nodes and 740 links as well as reservoirs and pump stations. The model links in with the city’s GIS system.
Belgrade Waterworks’ distribution development department and French company SCE began work in early 2005 on the FASEP project to improve the city’s water supply. The first step was to collect pipe network data from the field and analyze it. Data was then updated and digitized. All pipes, nodes and objects such as tanks and pumping stations wereoverlaid onto background AutoCAD maps. The system included full details such as diameter, material and age of pipes.
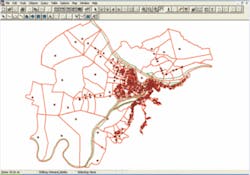
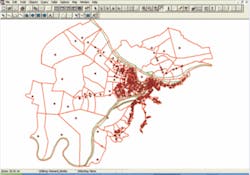
An area would first be mapped in AutoCAD, showing pipes in green, nodes in blue and hydraulic tunnels in red. Data was then imported into the software model and connected to adjoining sections to form a complete pressure zone. Polygons were created based on influence of each node and its demand. Every consumer’s water meter was allocated to one of the demand polygons. Spreadsheets showed daily consumption for each person and hence for each node and zone. Demand diagrams were set up for different parts of the city, with 23 types created for the first pressure zone. These were determined by account for the flow in the intake pipe that supplied the area. All data was imported into the model.
Belgrade Waterworks’ SCADA system provided information on the pump stations, reservoirs and control measurement points within the system. It could, for instance, be used to show reservoir depth over a period or at a particular time.
InfoWorks was used to carry out the full simulation of the first pressure zone once it was supplied with all the data on reservoirs, pump stations, node demand and demand diagrams. Calibration tests fine-tuned the model to account for factors such as unrecorded water loss or incorrect pump start times.
Collaborating with SCE, work was carried out on a pilot area in the first pressure zone to explore options for improvements to the supply. The pilot area was divided into four sections separated by valves. Measurements were made within the pilot area and collated, together with detailed information including the address, type of consumer, number of inhabitants and billed quantities in the previous two years.
Losses across the system were calculated using flow and demand measurements. Dividing the system into sectors enabled identification of leakage zones. System pressures are much higher at night than during the day, and so losses are greater. The decision was therefore made to reduce pressure in one of the zones and divide another area into sub-zones to reduce losses.
Work is now under way to digitize the second, third and fourth zones in preparation for modeling and calibration of them all within InfoWorks to complete the project.
Author’s Note:
Ana Popovic is a member of the Belgrade Waterworks & Sewerage water supply development team. This article is based on a presentation she gave at the Wallingford Software International User Conference in December 2006.