Water System Modeling Helps Determine Goals for Serbian Suburb
By Vojislav Marinkovic
InfoWorks WS has been used for preliminary design of a new water supply network for Novi Sad’s expanding suburb of Popovica in Serbia. Environmental and hydraulic engineering consultant Ehting used the project to introduce its client Novi Sad Waterworks and Sewerage PU to InfoWorks’ capabilities and, in particular, to the use of static demand allocation and customer points to show customers’ use of water throughout the network.
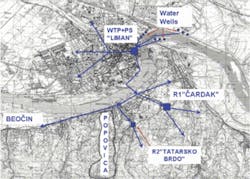
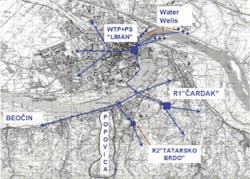
Situated along the River Danube, Novi Sad has a population of about 300,000 people - swollen in summer during the popular Exit international music festival. Its water system includes wells, two reservoirs, a potable treatment plant and a pumping station as well as the distribution network. Ehting was keen to show the benefits the Wallingford Software program could bring to the water network and felt design of the Popovica upgrade would prove an ideal demonstration.
Growth is putting pressure on Novi Sad suburbs such as Popovica, where large houses and development land are more affordable than in the city itself. But the existing water supply network is very old and insufficient for the increased demand and pressure requirements. Ehting therefore devised four alternative solutions. Each was analyzed and compared using simulations carried out within InfoWorks WS. The software system has proven an ideal platform for solving this problem since its customer points provided a way to increase significantly the detail of the model without need to increase the hydraulic network. Popovica’s water supply network connects into the Novi Sad waterworks. The suburb’s existing water is via a primary network - running largely along a main road - and the system also includes a pumping station and loop. Reconstruction and expansion was needed to cope with increased demand and pressure requirements from residents.
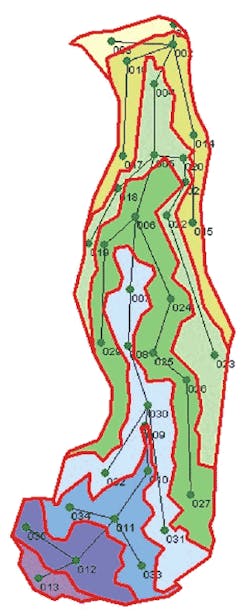
There was little information about the network, though, so the first step in designing an upgrade was to determine core input data for the model. Uncertainties included the number of current residents and scale of future growth. It was estimated households typically had three residents, for a population of about 7,000. Demand patterns across the network already were established by the client, so Ehting assumed a daily average consumption of 150 liters (40 gallons), with a seasonal peak factor of 1.6 and maximum peak hour factor of 1.5. This gave an average daily consumption of 19 L/s (5 gps) and a peak of 28.6 L/s (7.6 gps). Topography poses a particular challenge when supplying Popovica with water, as the ground slopes steeply from 100m above sea level to 330m - so the area was split into eight pressure zones. The static demand allocation tool within InfoWorks was used to set up all key criteria for the existing network. Work was carried out in stages, starting with the automatic allocation of customers to particular pressure zones and the appropriate pipes. Manual adjustments were made where necessary, such as if there was a reason for not allocating to a particular pipe. Allocation parameters included the maximum pipe size, allowable distances between customers and pipes, and the number of consumers that could use a node. A lack of existing data meant few other details were available. The tool was found to be a very effective, rapid way of assigning demand to network nodes. Preliminary analysis showed how the existing network was operating and confirmed accuracy of the model. The next step was to introduce new pipes to provide better service by being closer to the demand points. The existing primary network was about 10km long, but Ehting recommended that most needed replacing, with just 2.72km retained.
InfoWorks WS was used to analyze effectiveness of each of the proposed solutions. One factor in the simulations was the need to maintain a reserve volume in case of major fire or system failure. Four different solutions were identified:
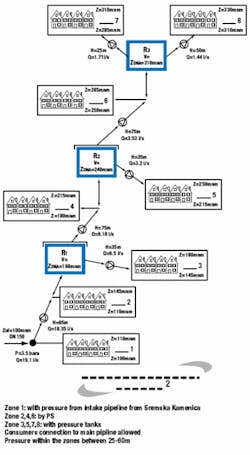
- The first involved a reservoir and one pumping station. The lowest zone would be supplied from the storage reservoir, with a pressurized tank for supplying the highest zone. The other six zones would be supplied by gravity, with pressure regulated by valves.
- The second involved a combination of a pressure main with gravity-fed distribution and included three pumping stations and three reservoirs. Some of the zones would be supplied by the reservoirs and some by the pressure mains.
- The third solution was similar, but used only gravity supply and didn’t have any consumer connections to the pressure main. Flow would be controlled throughout with pressure-reducing valves (PRVs).
- The fourth option was based on bringing about a reduction in maximum working pressure within the network. This involved increasing the number of zones from eight to 12 and reducing pressure wherever it was too high.
Modeling software was used to compare all four in terms of the number of zones, reservoirs, pumping stations, pressure tanks and pressure reduction valves needed, as well as water volume, energy consumption and network length. Further comparisons examined lengths of pipes needed at different pressures for each alternative. The first option had over 3km at a pressure of above 100m, while the others were more acceptable. Best results came from the fourth option, which had 17km within the 30m to 40m pressure band. It gave other benefits too, for instance, a substantial reduction in leakage compared with solutions with higher pressures.
Leakage also was quantified for the night-time flows. Pressure in the network ranged from 25m to 60m for the first three alternatives. InfoWorks showed the average calculated pressure to be about 40m. This meant that losses would be 27.6% or 1.88 L/s (0.5 gps) for a night flow of 6.8 L/s (1.8 gps) at the entrance to the zone.
The fourth alternative would bring a substantial improvement in this as valves would keep the pressure between 25m and 45m in each zone. This option’s average calculated pressure would be 34.7m (114 ft) - some 6m less than in the other solutions - which would give a much reduced loss of 22.4%. This saves some 30m3 of water a day - or 220,000m3 over a 20-year period. Water prices, however, are currently very low in Serbia, and reducing leakage doesn’t bring such great savings as in other countries. Serbia’s water price is about €0.37/m3 (US$1.85 for 1,000 gallons), which would yield a saving of€85,000 over a 20-year period.
Two of the other options proved to be considerably cheaper when all factors were taken into account, including construction, maintenance and energy. The second and third option would each cost about €2.7 million (US$3.6 million), while the fourth would be some €500,000 more.
Making the final decision involved considering a number of factors, including network costs, reliability and having a smaller pressure oscillation within the water supply network. The third alternative emerged as the preferred option. It was more expensive than the second, but its pressure oscillation was much smaller.
supply, with no consumer connections to the
pressure main.
The InfoWorks analysis showed the pricing balance would alter if more realistic water prices of at least €2/m3 are ever achieved. Savings from water losses would then be approaching €450,000 (US$594,000) over 20 years, bringing the total cost much closer to alternative three. There also would be benefits from pressure reduction, such as fewer accidents and less wastage.
Author’s Note:
Vojislav Marinkovic works for Ehting (www.ehting.co.yu), an environmental and hydraulic engineering consultancy based in Belgrade, Serbia. This article is based on a presentation given by him at the Wallingford Software International User Conference in December 2006. Contact: +44 (0) 1491 824777, [email protected], or www.wallingfordsoftware.com


