Taming the backlog beast

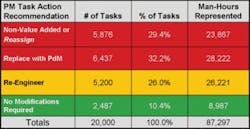
Eliminating the non-value added preventive and predictive maintenance tasks would free up additional hours to reduce backlog and increase asset availability.
So you have taken the time to develop your processes for maintenance work control, you have implemented a requested work approval process to limit bogus work orders, your planners are truly planning and scheduling work, but you just can’t seem to escape the weight of that excessive maintenance backlog.
You hear the best practice stories of four to six weeks of backlog and you can only sigh because your personal best hovers around 19 weeks and that was after you purged the duplicates and “never dos.”
Operations and engineering are purchasing additional equipment and designing in redundancy because they can’t get the availability and throughput they need with the equipment they have. The long delays that further extend the time from request to completion are beginning to undermine your credibility with your work requesters. You need to tame your backlog and you need it soon.
What can you do? What options do you have? If this situation sounds familiar, here is one way to get a leash on your backlog of work.

The first step is to understand what the current backlog contains. If it is all approved work and is still applicable then you need to begin your search for additional resources to chip away at the number of weeks of backlogged maintenance work awaiting completion. We know that head count increases are not an option but could there be other ways to increase your backlog through put?
The good news is that recent studies of a cross section of industries have found that approximately thirty percent of preventive maintenance hours currently being executed are absolutely non-value added. Another thirty percent could be transferred from time-based traditional preventive maintenance (PM) to more efficient and effective condition-based (predictive) maintenance freeing up additional resources. If we had a reliable way to eliminate only the non-value added PMs, this would free up additional hours to tame our backlogs and increase the availability of our assets. So how do we get there?
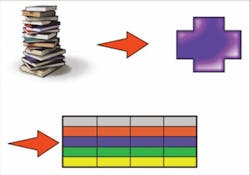
You probably have an existing process that you have used in the past that may not be working. Once you understand that system, compare it to best practice, keep what works and replace the weak links. A sample process is contained in figure 1 which will be used for this discussion.
Search for any tools that can add efficiency. The company Allied Reliability offered one set of such tools to all attendees of the PM/PdM Best Practices Workshop. In the next section we will discuss each of the process steps in figure 1 and what tools enable improved efficiency in those steps.
The first block in figure 1 is the process for Asset Hierarchy. In this step we must determine if the existing hierarchy is complete and allows us to collect information such as cost and downtime at the right level and roll them up to the higher levels. This allows for good data-driven asset management decisions that can be based off of life cycle costing.
The second step in developing an equipment maintenance plan for a group of assets is to verify the equipment hierarchy within the plant and collect specific technical information about the machines needed for the maintenance design process. This data comes from the asset nameplates, technical manuals, blueprints and installation drawings. The benefit of having this data is two fold. It improves the accuracy of parts inventory and purchasing. It also allows for the setup of condition-based monitoring technology databases. The best way to get this data is to physically walk down the plant with your hierarchy as the starting point. During this step you will verify the accuracy of your asset list. The tool that Allied Reliability provides for this task can improve accuracy and speed of collection. It is known simply enough as the “Walk Down Tool.” The tool is a software program that can run on tablet PCs or industrial computers and aides in the collection and storage of equipment reliability information. The premise of the tool is that the asset list is loaded into the software via a spreadsheet import. Then the asset of interest is selected and a listing of components becomes available to the user with which the asset will be configured. Upon choosing the component, a screen with specific fields relative to the selected component will appear. This allows for rapid data collection as the tool isn’t asking for information that isn’t specifically related to the component you selected. After the component information has been collected for a given asset, the user simply selects another asset and begins the process again.
A built in function allows the user to export all the collected data in the software tool to a spreadsheet. From here it can be used to populate a CMMS or imported directly into the Criticality Analysis tool.
Once you determine that you have the correct asset list and all the existing information then it is time to determine the relative importance of each asset to the entire process. This is called asset criticality. For the criticality ranking of an asset to be correct, it must reflect the relative rankings of several efforts within the plant. For example, a particular machine may be very important to maintenance, but not important at all to operations. Or the failure of a machine may be extremely important for environmental compliance, but have no bearing on production rates. Additionally, a well-performed criticality analysis will help clarify parts inventories, determine correct preventive maintenance schedules, correct condition based monitoring routes, and overall maintenance strategies.
The Criticality Analysis tool helps you determine the relative criticality analysis ranking for all of your assets. This is accomplished through the use of preformatted questions and answers falling into five categories. The categories are: Safety Impact, Maintenance Workflow and Cost, Customer and Quality Impact, Environmental Impact and Process Impact. The next step is the development of a basic Asset Management Plan (AMP). The AMP will contain most of the information about the asset and will be started in this step and completed as part of your continuous improvement loop. It contains information on function, environment, predictive maintenance (PdM) tasks, preventive maintenance plans, run-to-failure tasks, operator tasks, and maintenance schedules.
In the fifth process step, tools such as Reliability Centered Maintenance (RCM), Failure Modes Effect Analysis (FMEA) and the Allied Reliability Asset Health tool are used to identify all of the potential failure modes that assets could encounter and develop an action plan to combat those failure modes. You may find that you use two or even parts of all three to get the most improvement over a given time.
The Allied Reliability Asset Health Matrix tool helps efficiently analyze the more common equipment. Contained within the tool is the ability to match specific failure modes to the PdM technology or preventive maintenance inspection/task that is best suited to detect it. The tool is designed to accept the import from the Criticality Analysis tool or a spreadsheet that contains the asset hierarchy, criticality ranking and associated asset types. This data is then processed by the AHM tool and the output is a listing of all of the assets and all of the PdM/NDT technologies that should be applied to detect the known failure modes for that asset.
Some of the custom functions of the tool include the ability to sort the technology applications by percentage coverage. For example, if you wanted to have 100% coverage of infrared (electrical), but only 86% coverage on vibration analysis, then the built-in filter functions of the tool allow that. This tool is the cornerstone of the Allied Reliability tool suite and helps the user quickly determine which PM/PdM/NDT tasks need to be applied to identify all of the available failure mechanisms that may be present in an asset.
The last step in our journey is the Preventive Maintenance Optimization step. In this step the non-value added tasks are eliminated, which frees craft time needed to control backlog.
It is a widely known statistic that most of the preventive maintenance (PM) programs in the US have many unnecessary tasks built into them. An indication that your PM program is like this may be that you have a high PM completion percentage and even your actual PM man-hours are within 10% of your estimated PM man-hours and yet your % of reactive work is still high and your maintenance costs continue to rise.
Perhaps it is time to LEAN out your PM program. The Allied Reliability Preventive Maintenance Evaluation (PME) tool is designed to help you do just that. These tasks may then be separated into one of four categories, which are: inspections, asset care, time-based replacement or a quantitative PM. After this, a recommendation is made for each task.
The options for these recommendations are:
In terms of maintenance this task doesn’t specifically address a failure mode but may be necessary/desirable in terms of workspace cleanliness and general housekeeping.
This task is purely related to the proper lubrication of the machine and should be given to a task trained, professional, lubrication specialist.
This task has no value whatsoever and should be removed.
This task does specifically address a failure mode but a PdM/NDT task is much better suited to identify the failure mechanism.
In general the task may be well suited for the PM program because it specifically addresses a failure mechanism however the task itself is poorly defined. The task needs to be clear, concise and specific.
This task is well defined and well designed. No modifications are necessary.
The output of this software tool is a report detailing the % of tasks that fall into each of the six categories noted above. These percentages can be multiplied by the total number of man-hours that are dedicated to preventive maintenance per year thus yielding the amount of maintenance labor that can be reallocated to other activities like an internal PdM program or working down the ready backlog or other maintenance work. This data allows for the optimization of your PM/PdM program by identifying the changes that are necessary to free up craft hours, drive your program to a failure mode based program, and improve overall equipment effectiveness.
The last step or a better way to call it is the beginning of the continuous improvement loop was to remove any non value added tasks that are left as well as insure all new tasks provide value as written. Once each of these steps are understood and instituted then you can begin to continuously improve your Preventive and Predictive Maintenance and release the craft hours needed to better control your backlog.
Authors’ Note
Shon Isenhour, CMRP is the a Principal Subject Matter Expert of Life Cycle Engineering, based in Charleston, South Carolina, USA. Andy Page, CMRP is the Director of Training for Allied Reliability, Inc. headquartered in Charleston, South Carolina.