Mayors’ Survey Examines Water Resource Concerns
Water resource issues continue to gain attention in the academic, professional, popular and special interest literature. Considerable focus has been placed on the U.S. Environmental Protection Agency’s Needs Gap reports indicating that more than $500 billion of investment is needed over a 20 year period to comply with existing law; and the American Society of Civil Engineer’s Report Card indicating the current inventory of water and wastewater infrastructure is inadequate. While these and other water resource issues are national in scope they are often defined at the regional and local level. Yet, there is a dearth of information about how cities view the multiplicity of water resource issues. This is unfortunate because local government is among the biggest financial investors in water resources in terms of both water quality and water supply.
The United States Conference of Mayors’ (USCM) Urban Water Council (UWC) conducted a survey of the nation’s principal cities (30,000 population or more) in the first quarter of 2005 to examine water resources priorities and trends. The survey asked Mayors to provide current information in four key water resources areas: issues and priorities; recent and planned major capital investments in water and wastewater infrastructure; adequacy of water supplies; and water conservation activities. The UWC has tracked these four areas (and other areas) of concern for over a decade.
A survey was distributed to nearly 1,200 cities with Mayoral forms of government. A substantial portion of the United States population resides in these cities, and they are significant contributors to metropolitan economies. The survey was not sent to local governments that are counties or cities that do not have mayoral forms of governance. The survey netted a 35 percent response rate including 414 cities. Thus, the survey information provides a relatively robust characterization of water resource issues at the local government level. Key findings of the survey are presented below.
Water Resource Issues and Priorities
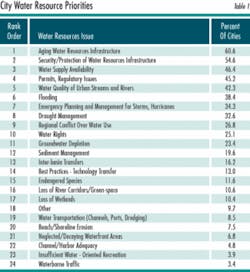
Mayors were asked to identify which of 24 water resources issues is either a current or future issue or priority for their cities. The list was derived from discussions with Mayors and their staffs, water professionals, UWC staff and federal agencies. The list was not intended to be comprehensive. An ‘other’ response category was included to allow cities to identify issues that were not on the pre-selected list.
The top three priorities, measured by frequency of survey response, are: aging infrastructure (60.6 percent); water infrastructure security (54.6 percent); and, water supply availability (46.4 percent).
The top three priorities were grouped with other high priorities into categories representing chronic “every-day” problems associated with maintaining and rehabilitating aging water and wastewater infrastructure, and a number of priorities associated with potential “catastrophic events”.
The chronic “every-day” problems (priorities) include: aging infrastructure (60.6 percent); permits and regulatory issues (45.2 percent), and water quality (42.3 percent). Additionally, concern over water supply availability was identified as the third highest priority (46.4 percent). Three other water supply related priorities were identified among the top 10 concerns: drought management (32.6 percent); regional conflict over water use (26.8 percent); and, water rights (25.1 percent).
The potential “catastrophic events” issues include the number two priority: water infrastructure security (54.6 percent); the number six priority, flooding (38.4 percent); and the number seven priority, emergency planning and management for storms and hurricanes (34.3 percent). It is interesting to note that cities identified flooding and emergency planning for storms and hurricanes as priorities more than six months before Hurricanes Katrina, Rita and Wilma struck the gulf coast area.
Major Capital Investment and Financing Methods:
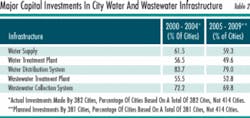
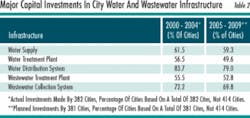
The nation’s principal cities are engaged in wide ranging and significant investment in building and rehabilitating the five major forms of water and wastewater infrastructure during the period 2000-2009: water supply; water treatment plants; water distribution systems; wastewater treatment plants; and, wastewater collection systems. Ninety-two percent of the survey cities made major capital investments in water infrastructure between 2000 and 2004; 92 percent of the cities plan to make major capital investments between 2005 and 2009. Twenty-three percent of the survey cities made simultaneous major capital investments in all five water infrastructure categories between 2000 and 2004.
Significant investment in underground infrastructure has been made or is planned: 83.7 percent of cities invested in water distribution pipes, and 72.2 percent of cities invested in wastewater collection pipes between 2000 and 2004. Seventy-nine percent of cities plan investment in water distribution pipes, and 69.8 percent of cities plan investments in wastewater collection pipes between 2005 and 2009.
Roughly one-half of the survey cities either made or plan major capital investments in water supply, water treatment plants and wastewater treatment plants. Many smaller cities made or plan water infrastructure investment between 2000 and 2009, but clearly a higher proportion of large (> 100,000 population) and medium size (> 50,000 but < 100,000 population) cities are making investments than smaller cities (< 50,000 population).
Mayors were asked to identify the financial methods used to make major capital investments in water and wastewater infrastructure. Survey questions were intended to elicit whether or not cities relied on single-source (meaning one form of financing) or multiple-source financing.
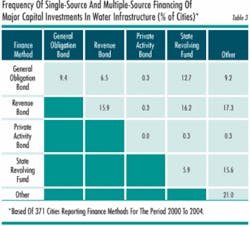
A small majority of cities (52.3 percent) relied on single-source financing for water infrastructure between 2000 and 2004; and a small majority of cities (53.5 percent) plan to utilize multiple-source financing between 2005 and 2009. The single-source financing method used most frequently by the survey cities was the category “other,” which was described as “Pay-As-You-Go.” This approach relies on user charges, rate increases and capital reserves generated from user charges. Pay-As-You-Go accounted for 21.0 percent of the survey cities that relied on single-source financing between 2000 and 2004; and, this method was used in combination with other financing methods by 51.7 percent of the survey cities.
In descending order of frequency, the following financing methods are used by cities for water infrastructure investments: Pay-As-You-Go, 51.7 percent; revenue bonds, 46.1 percent; State Revolving Fund (SRF) loans, 38.3 percent; general obligation bonds, 28.8 percent; and, private activity bonds, 0.8 percent.
Adequacy of City Water Supply
Water supply availability was identified as the third top priority by the survey cities. For the most part, cities try to be self-sufficient when it comes to water supplies. Two-thirds of the survey cities provide their own water supply; and roughly 19 percent of the cities are served by private water companies. Some cities face a convergence of issues that impact their ability to provide adequate and affordable water in their communities. The survey cities identified the following issues: drought management; water rights; inter-basin transfers; ground water depletion; and regional conflict over water use.
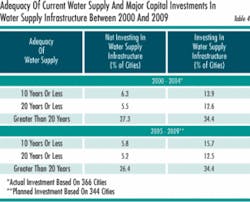
A majority of the survey cities (55.6 percent) indicated that they have an adequate water supply for more than 20 years. A finding of great concern was that 35 percent of the survey cities indicated that they have an adequate water supply for less than 20 years. Those cities could face a critical water shortage by 2025. Water shortages may be more pronounced in medium size cities. Sixty-nine percent of the cities that do not have adequate water supplies for more than 20 years have made major capital investments in water supply infrastructure between 2000 and 2004; and, 72 percent of cities facing shortages in 20 years are planning to invest in water supply infrastructure between 2005 and 2009.
City Water Conservation Activities:
The potential for cities to experience critical water shortages in 2015 and 2025 elevates the importance of water conservation activities. Even if cities do not face a critical water shortage it makes good economic and environmental sense to conserve water resources. The survey findings indicate that cities are currently actively engaged in water conservation programs.
Two-thirds of the survey cities indicated they had water conservation plans in place. A high proportion of large cities (about 80 percent) indicated they had conservation programs. The proportion of smaller cities with conservation programs was lower (58.6 percent). Cities were three times more likely to have water conservation programs where water supply infrastructure investments were made in the period 2000 to 2004. Cities planning to make major capital investments in water supply infrastructure for the period 2005 to 2009 are nearly four times as likely to have an established water conservation program.
Two system-wide methods that can be effective in water conservation programs are automated meters because they accurately gage use and billing; and altering water rate structures as a demand-management tool. Traditional water meters remain the most common measurement technique, employed by 72.5 percent of the survey cities. However, 68.8 percent of the cities indicated they would consider modernizing with automated water meters if they could save water or money. While the number of cities altering water rate structures is fairly constant over the three population size categories, the proportion of cities employing the technique is clearly related to increasing population size. Almost half of the larger cities use the technique, while only about 40 percent of medium size cities and about 30 percent of smaller size cities do.
Discussion
The city water resources survey provides useful information to Mayors and their water and sewer (and public works) staff both for policy and finance purposes. This is the first survey in recent time to document the relative priority of multiple water resources issues for cities with Mayoral forms of government. Not surprisingly, aging water and wastewater infrastructure and water supply were dominant concerns. The relatively high priority placed on water system security was not surprising given the intense interest in anti-terrorist planning and activity since 2001. The high priority placed on emergency planning for floods, hurricanes and storms was surprising, especially since these priorities were identified before the 2005 hurricane season.
The level of water and wastewater infrastructure investment that cities engage in is substantial. It is noteworthy that many cities are making simultaneous investments in all five of the major infrastructure categories examined by the survey. Traditional financing mechanisms continue to dominate. Pay-As-You-Go financing is the most common form of investment. This suggests that user charges that generate capital reserves and rate increases play a key role in addressing the problems cities face with an aging water infrastructure. Pay-As-You-Go, revenue bonds and general obligation bonds, generally, outpace the use of the State Revolving Fund (SRF) loan program. The SRF remains an important financing tool, but is less often used than the other forms of financing.
Perhaps the most important finding of the survey is that about a third of the cities surveyed may face critical water shortages by 2025. This finding suggests that water conservation efforts, as well as public policy concerning water supply will have a significant impact on cities in the near future.
Finally, how representative is the survey of local government? The reader should bear in mind that there are roughly 1,200 cities in the United States with populations of 30,000 or more. The findings reported for the 414 cities are likely representative of a good many other cities. However, there are two inherent biases in the survey data. First, many (but not all) of the cities that responded to the survey are member cities of The U. S. Conference of Mayors. Second, cities that responded to the survey are probably more concerned about water resources issues than cities that did not respond, although this is assumed.
