Software Provides Hurricane Response Emergency Modeling
The island of Jamaica has a population of 2.6 million, 800,000 of whom live in the metropolitan area of the capital, Kingston. The island is mountainous, with a distinct east-to-west ridge and a dramatic relief change in the east.
Like the rest of the region, Jamaica suffered the impact of tropical cyclones in 2005. The Caribbean islands are also in the direct path of the seasonal hurricanes. Rainfall associated with these events can be as high as 12 inches in 24 hours. Landslides, flooding, wind damage and storm surges are the main threats, and in Jamaica most are major risks.
Infrastructure - and in particular road and water supply systems - are particularly susceptible to storm damage. This possibility was realized when Category Three Hurricane Dennis hit on July 7, 2004, and the raw water pipeline to the Sea View water treatment plant was destroyed. It was estimated that repairs to the supply for some 35,000 people in the high-value area would take up to four weeks. Since this was the only supply line to the treatment plant, an interim supply was urgently needed.
It was agreed that a network model of the area should be rapidly deployed to assist in the operational steps and decision-making. Unfortunately, the network in question did not have a hydraulic model, which exacerbated an already difficult situation.
Emergency Modeling
Fluid Systems Engineering in Jamaica was commissioned by the National Water Commission to create the emergency model using Wallingford Software’s InfoWorks WS solution, which it had recently purchased. The company had just four days in which to develop a working model before a key meeting.
“There was no data and the results were needed yesterday,” said Model designer Maurice Jones.
A team of data entry personnel and modelers worked around the clock in ESRI ArcView and InfoWorks WS to determine the initial alignment of pipes, node locations and street names.
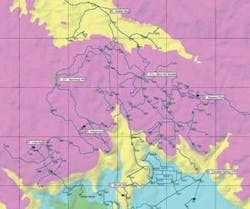
Model analysis started as soon as node data was imported. Since DTM was available, node elevations could be accurately determined. The initial analysis consisted of a simple plot of the node elevation contour, which gave a general picture of the supply problems.
In the model construction phase, automated InfoWorks WS tools for model construction, data validation and inference were important time savers. InfoWorks tools were used for refining pipe alignments, node locations, adding pipe and node data, estimating missing data using the inference tool, as well as extracting the information on reservoirs, pumps, and control valves from background images.
Initial validation included use of the proximity and connectivity trace tools, which Maurice Jones said was essential. Next, any nodes showing zero elevation were checked and their elevations were estimated from DTM using inference tools.
After basic physical validation, trial demands were assigned to nodes for basic testing of the model. The initial analysis found that to divert supply from the west required system adjustments to PRV (pressure reducing valve) settings and placing some control valves on the bypass for reverse flow operation.
Conclusions
The model was developed, validated and used to find an alternative supply option within the tight four-day window thanks to some incredibly hard work and the tools available in InfoWorks WS.
The solution was created in four days, whereas it took eight weeks to fix the pipe network - if the emergency workers had relied solely on fixing pipes, people would have been without water for close to two months.
Important InfoWorks WS tools for emergency situations include:
* The ability to allow clients to view, query and analyze GIS data, network data and multiple sets of results at the same time.
* Data import, validation and inference tools, which are crucial to disaster model building as they provide the ability to import data from diverse sources to InfoWorks that will be auto-validated and corrected.
* The ability to track the source of data - InfoWorks’ data flags allow modelers to identify where data came from, whether from existing information, external sources, assumptions or guesses, allowing users to link levels of certainty to model results.
* The ability to maintain a live link to external data sources such as GIS, which allows seamless updates as the project progresses. InfoWorks provides the tools to automatically map keys within the model to keys within GIS.
* 3D modeling - the ability to view DTMs and networks at the same time was critical in the early stages of the Jamaica project, making it easy to differentiate areas where water could be supplied by redirection (by opening or closing valves in the system), or by pumping or trucking.
* Tight integration between GIS and the network model, which not only allows speedy hydraulic analysis but also enables emergency workers to draw up trucking routes.

