Resilience Modeling
A risk-based approach to support asset investment decisions
By Neil Wragg
Two years after the launch of AMP6, water companies are taking steps to increase water efficiencies and decrease wastewater effluents to reduce escalating costs to customers. In support of AMP6, DNV GL has applied proven analytical modeling techniques used in the oil and gas industry to support key investment decisions for water companies through resilience modeling.
Background
Asset management in the UK water sector has changed beyond recognition since privatization. Companies are now able to plan their investments appropriately for the provision of customer services, subject to justifying their plans to the regulators. Investment has flowed into the industry to replace deteriorated assets and to improve the quality of drinking water and rivers.
The 2004 UK water industry price review was supported by the introduction of a Capital Maintenance Planning Common Framework to help companies understand and explain their maintenance investment requirements. This framework was designed to enable businesses to demonstrate the need for future investment in terms of customer serviceability, setting out basic steps for companies to follow to develop their plans.
More recently, in September 2017, UK water regulator Ofwat published its report, “Targeted Review of Asset Health and Resilience in the Water Industry.” It investigated how water and wastewater companies in England and Wales are approaching the measurement and management of asset health and how this contributes to the wider approach to resilience. It presented a number of key challenges to water companies, including:
• Driving greater innovation in the sector. While water companies have been active in testing and adopting technology, this has not yet led to a clear step-change in either asset performance or understanding of risks to service. The report points out that innovation in other sectors is considerably greater.
• Ensuring a long-term mindset is adopted when considering investment in asset health. Some companies recognize they tend to focus on performance within the review period and that they generally monitor asset health by considering current failure rates rather than using leading indicators of long-term risks.
• Developing a stronger understanding of how asset health affects service. With particular concern for high consequence/low failure frequency infrastructure assets, companies should further develop their understanding of the location of these assets, how their health will impact service, and consider whether capital maintenance needs to keep pace with asset deterioration.
Analytical modeling techniques widely used in the oil and gas industry can be applied to support key investment decisions for water companies. (Photo: Shutterstock)
What Is Resilience?
The Resilience Task and Finish Group, established by Ofwat in 2015, proposed a definition of resilience that is now widely accepted within the water industry: “Resilience is the ability to cope with, and recover from, disruption, and anticipate trends and variability in order to maintain services for people and protect the natural environment, now and in the future.”
The resilience of a treatment facility is a fundamental factor in maintaining continued compliance with specific performance criteria, whether that is environmental discharge consent requirements, water quality parameters or throughput expectations. The resilience of a treatment facility combines performance of the treatment process with the availability of critical equipment.
As such, compliance with increasingly rigorous performance expectations will not be achieved without processes that can treat to the required standards, equipment and systems that ensure continued operation at the necessary levels under all reasonable circumstances.
The evaluation of the resilience of a treatment facility should be an important part of its design and operation. However, this has traditionally been difficult to assess and quantify, and as a consequence, its management has largely been ignored.
What Is the Value of Resilience Modeling?
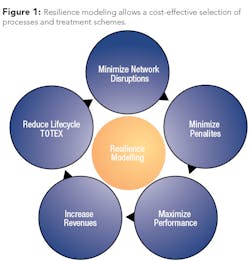
Resilience modeling allows an effective selection of processes and treatment schemes. It also provides a critical means of influencing and assessing investment decisions and operational and maintenance planning in order to minimize the overall cost of compliance.
Without proper resilience assessment, there will always be a tendency to default to a “belt and braces” approach as a means of managing the compliance risk, leading to “gold-plate” engineering, with specifications much higher than the business need. This in turn leads to excessively higher TOTEX over the life of a treatment asset.
The key reasons for carrying out resilience modeling, as shown in Figure 1, are to:
• Maximize performance: Identify areas of unreliable equipment and system bottlenecking to increase performance.
• Minimize network disruptions: Provide focus on vulnerable assets and network legs that have potential to cause loss of supply to customers.
• Reduce life cycle TOTEX: Understand areas where CAPEX investment (e.g., equipment sparing, spares holding) and OPEX (e.g., maintenance strategies) results in the largest improvement in resilience and overall TOTEX savings.
• Increase revenues: Increase profit through minimizing losses and maximizing process efficiency.
• Minimize penalties: Reduce the likelihood of penalties being imposed (e.g., breaching consents, water disposal volumes, customer water supply interruptions).
The resilience of a treatment facility combines performance of the treatment process with the availability of critical equipment. (Photo: Shutterstock)
Where Is Resilience Modeling Used?
Resilience can be assessed across the full water cycle, encompassing drinking water treatment, sewage and trade effluent treatment, and sludge treatment and disposal. Typical uses of resilience modeling have included the following:
• Comparison of proposed schemes and alternative technologies in design phase.
• Identification of critical and non-critical equipment.
• Risk-ranking of treatment works.
• Development of investment, operational, maintenance and spares holding strategies.
• Operational troubleshooting and identification of capacity bottlenecks.
In recent years, DNV GL has been working closely with a number of UK water companies to optimize the design and operation of their assets. Using resilience modeling in this way, a number of key factors can be brought together and assessed, including equipment reliability; system capacity and criticality; operations and maintenance strategy; flow rates and discharge consents; maintenance resources and spares holding.
DNV GL has developed resilience models for a number of different asset types, including wastewater treatment, clean water treatment, and distribution networks.
Wastewater Treatment
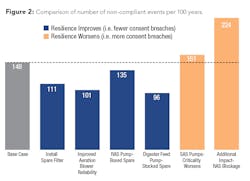
DNV GL developed a decision support tool to assess the resilience of wastewater treatment plants. Performance was measured by the frequency of non-compliant breaches in environmental discharge consent (see Fig. 2).
The company’s performance resilience model was used to consider historical equipment data, equipment configuration and process criticality. It also analyzed input from site personnel on maintenance, spares, equipment performance and impacts. The following results were achieved:
• Forecast number of non-compliant events
• Identify key contributors to non-compliant events
• Identify opportunities to improve plant resilience and test sensitivity to asset deterioration, including consideration of:
Spares availability
Maintenance strategy
Equipment failure frequency
Duty/standby arrangements
The flexible resilience tool enabled the operator to update the model and use it to support decisions for the following aspects:
• Installing spare equipment: By highlighting key contributors to non-compliant events, the benefit of additional equipment redundancy to plant resilience was quantified.
• Maintenance and repair strategy: By changing the frequency of equipment failures and duration of repairs, identified the most critical equipment to plant performance.
• Spares holding: Having boxed and stored spares available on site could significantly reduce the number of non-compliant events.
• Plant load: Impacts change depending on the flow through the facilities (e.g., increase in plant load due to population growth). The model predicted the expected increase in non-compliant events.
• Additional impacts: Any known or expected issues (e.g., extreme weather events, blockages during winter) were included to quantify their impact on plant resilience.
• Capital replacement: Comparative assessment between different options performed.
Clean Water Treatment
DNV GL performed a resilience study of a concept-stage clean water supply scheme. This identified potential improvement opportunities that could be achieved through changes to the design, operation and maintenance of the treatment works.
Resilience modeling was to consider real equipment reliability data from comparable treatment works, equipment configuration and impacts with input from industry experts, and input from operational staff to rationalize maintenance and spares assumptions. The following results were achieved:
• Forecast water supply availability from the treatment works
Identify key system and equipment contributors to supply loss
Sensitivity cases were performed to quantify improvement opportunities:
• Reduced restart times: Reduced restart times following a treatment works outage had minimal benefit on overall water supply.
• Reduced equipment repair lead times: 24-hour repair lead times for key pumps and actuators showed significant increase in water supply.
• Additional sampling systems: Sampling systems were flagged as highly critical in the design, and a significant performance improvement was observed, including additional sampling systems for filter banks.
• Flow meter redundancy: A low-cost option of installing standby flow meters in key flow routes showed a significant increase in water supply.
• Tank compartmentalization: Compartmentalizing tanks such that maintenance and repairs can be carried out on individual compartments with minimal or no flow impact showed some improvement.
• Common lamella pumps: Installing common pumps, rather than pumps dedicated to individual clarifiers, resulted in improved water supply.
• Revised planned maintenance (PM) schedule: A revised PM schedule, including workarounds during planned maintenance with minimal flow impact, resulted in the highest benefit in water supply.
The value of these improvements to the water company is summarized as follows:
• Water supply: Prediction of 40-year water supply forecast.
• Optimized design configuration: Quantified reduced supply loss through installation of ‘n+1’ equipment configuration.
• Decision support: Development of spares holding strategy and maintenance plan to reduce major outages with long lead times.
• Asset reliability database: Developed an asset reliability database using real historical asset data from comparable treatment works (from CMMS) to quantify Mean Time to Failure (MTTF) and Mean Time to Repair (MTTR) for each equipment type.
DNV GL performed a resilience study of a treated water distribution network to understand the vulnerability of customers to loss of supply events. (Photo: Shutterstock)
Distribution Network
Resilience modeling was performed to consider a number of factors. This included water supply demand through individual network legs, operating requirements of pumping stations and the water storage buffer from storage reservoirs. It also analyzed pipeline leak and burst frequencies using data from historical experience as well as equipment configuration and maintenance strategy. The following results were achieved:
• Forecast water supply through each network leg
• Key contributors to network supply losses
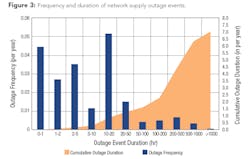
• Frequency and duration of supply outages at each end point service reservoir (see Fig. 3)
• Causes and mitigations of supply disruption events to customers
Value to water company:
• Impact of disruptions: Since service reservoirs would not be able to sustain supply to customers during extended outages, these results highlighted the requirement for emergency workarounds of key equipment items to maintain security of supply.
• Contributors to lost water supply: Identification of equipment/asset types and network distribution legs most likely to cause water supply loss gave focus to spares holding and repair lead times on vulnerable network legs.
• Supply outages: Quantification of the supply outage frequency and duration spread across each network leg provided insights into critical end point service reservoir requirements. WW
About the Author: Neil Wragg currently heads DNV GL’s Performance Forecasting team in Loughborough (UK), and is responsible for managing its global project portfolio. He has specialist knowledge and experience in reliability and availability modeling techniques and has presented technical papers in this field at conferences worldwide. Also experienced in lead engineer and project manager roles, Wragg has worked for a number of major upstream engineering design contractors on completion of proposals, conceptual studies, and front-end and detailed design projects (both onshore and offshore developments). He has 22 years of process engineering and performance forecasting experience across a number of different sectors, holds an MEng in chemical engineering, and is a chartered member of the IChemE.
Circle No. 234 on Reader Service Card


