Picking the Right Pump
About the author: Stan Kutin is an instructor for Bell & Gossett’s Little Red Schoolhouse. Kutin can be reached at [email protected].
Knowing how to read a pump performance curve is critical when selecting a centrifugal pump for an HVAC or hydronic system in a commercial building. Choosing the right pump for the facility will maximize pump and system efficiency and prolong the life of the system.
Pumps & Pump Curves
A centrifugal pump uses an impeller to move water or other fluids through it. The amount of pressure the pump is required to overcome indicates where the performance point will be on the curve and how much head is produced.
The manufacturer, under carefully controlled test conditions specified by international standards, establishes pump curves, which illustrate the relationship between how much flow (Q) a pump can deliver against the corresponding head (H).
Every pump design, speed and impeller diameter has a different performance curve. By understanding all of the information a performance curve provides, a specifying engineer can make informed decisions about the pump type, size, speed, horsepower and efficiency a system requires.
Flow rates (horizontal axis) typically are measured in liters per second, gallons per minute or cubic meters per hour. The amount of work or energy a pump can apply to a specific flow is measured in meters or feet of head (vertical axis).
Pump curves are illustrated as foot head versus liters per second or gallons per minute, giving a general description of pump operation unaffected by water temperature or density. The gallons per minute versus foot head capacity curve is standard due to the physical characteristics of centrifugal pumps.
Centrifugal pumps produce energy in the form of foot-pounds per pound of water pumped (head), and are dependent on the volume flow rate passing through the impeller. Energy as foot-pound per pound is shortened to foot head by mathematical term cancellation. Because foot head is a simple energy statement, a pump curve defined by this term is not affected by water temperature change, because energy is not affected by temperature change. Similarly, water density has no effect on a pump curve, but it does affect power requirements.
Reading the Curve
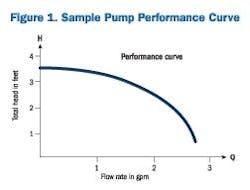
The curved line on a pump performance graph illustrates the flow/head relationship of a specific pump at a known speed and impeller diameter. Changing the speed or impeller diameter will produce a new flow/head relationship for the pump and alter the curved line. As pressure increases, flow decreases, repositioning the performance point to the left of the curve. As pressure decreases, the performance point shifts to the right of the curve and flow increases.
To read the curve, find a point on the horizontal axis, which represents gallons per minute. Then draw a vertical line until it hits the pump curve. At the intersection, draw a horizontal line toward the left axis to identify the head. This determines the feet of head the pump will deliver.
Similar readings can be taken from the vertical axis. If a specifying engineer needs to know the flow rate at 3 ft of head, draw a line from the 3-ft mark on the vertical axis until it intersects with the curve. Then, draw a line straight down to the horizontal axis at 1.5 gal per minute (gpm). In this example, at 3 ft of head the pump will deliver 1.5 gpm.
The first step in proper pump selection is to ensure that the required system flow and head fall on or marginally below the pump performance curve. The additional steps involve comparing more information, such as horsepower and efficiency, included on the performance curve to eliminate poor-performing pumps from consideration.
Choosing the best pump for the facility extends the life of the system and ensures it performs efficiently. Knowing how to read a pump performance curve ensures that the right pump is selected.
