Creating an Accurate Pumping System Head-Capacity Curve: First Step Towards Reducing Energy Consumption
By Allan R. Budris, P.E.
Any serious pump energy cost reduction effort should start with the development (confirmation) of the true current pumping system “Head-Capacity” curve, as pointed out in my January 2008 Column. The true system head-capacity curve not only permits the accurate determination of the current pump operating conditions, but it is also required to establish realistic potential energy cost savings for optional improvement actions.
As part of the design of most pumping systems, the initial head-capacity curve is normally calculated, based on either “as-new”, or maybe 10 year old, pipe and fittings losses. However, as piping systems age they may not follow these theoretical friction loss estimates, which can push the pump to higher or lower flow rates then planned. A field test of the pump head at one or more measured flow rates can help determine the actual, current, pump and system H-Q curves.
A pump field test should include both pump suction and discharge pressure measurements (with a minimum of two pipe diameters of straight pipe in front of the gauges), along with sizes of the suction and discharge pipes (at the pressure gauge connections). Further, the heights of the suction and discharge gauges, with respect to the center line of the pumps, should be determined, since all pressure measurements must be adjusted to the pump center line. What should ultimately be measured is the total head developed by the pump, between the pump suction and the pump discharge. Total head is comprised of three components: Static Pressure (head), Elevation Head, and Velocity Head. The formula for the Total Head Developed by a pump is:
HPump Total = (pd – ps)*2.31/S.G. + (hvd – hvs) + (Zd – Zs)
Where:
- p d = Discharge gauge pressure (psig)
p s = Suction gauge pressure (psig)
h vd = Discharge velocity head, V d2/2g (feet)
h vs = Suction velocity head, V s2/2g (feet)
V d = Discharge pipe velocity (feet/second)
V s = Suction pipe velocity (feet/second)
g = Acceleration due to gravity (32.2 feet/second 2)
Z d = Elevation discharge gauge distance above pump center line (feet)
Z s = Elevation suction gauge distance above pump center line (feet)
S.G. = Liquid specific gravity (cold water is 1.0)
Ideally, the pump field (total head) data should be taken at both the average and full open throttle valve settings. The accuracy of these measurements is only as good as the accuracy of the gauges, so (if possible) calibrated pressure and flow gauges should be used. Field bourdon type pressure gauges are notoriously inaccurate. See reference number 1 for more details on pump testing.
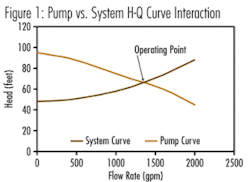
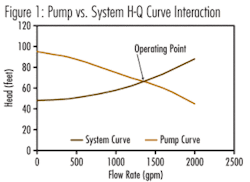
Now, since we know that the pump will operate at the intersection of the “pump” and “system” H-Q curves, once the pump is field tested, not only do we have one (or more) points on the pump curve, but we also have one point on the system curve (see Figure 1).
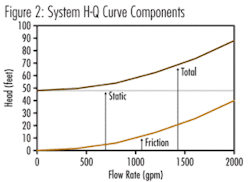
But what about the other points on the system curve? Well they can be established by knowing two basic characteristics of system curves. First, system curves are comprised of two components, a “static” (or fixed) component which does not change with changes in flow rate, and second, a “friction” component which increases with increasing flow rates (see Figure 2).
The system static head is made up of the change in elevation of the pumped liquid (height of discharge vessel liquid level minus the height of the liquid in the suction vessel - in feet); plus the change in static (gauge) pressure head (discharge vessel gauge pressure head minus the suction vessel gauge pressure head - feet).
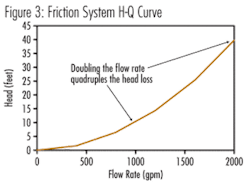
Also we know that the “friction head” portion of the system H-Q curve is proportional to the velocity head (see Figure 3), which means that it follows the square rule. If we double the flow rate the friction head will increase by a factor of four, for example.
So (from the example shown in Figure 1), by subtracting the system static head (48 feet, found at zero flow), from the total measured pump/system head at 1300 gpm of 65 feet, we get a friction head component of 17 feet. By following the square rule for other flow rates for the friction head portion, the complete system H-Q curve can be developed.
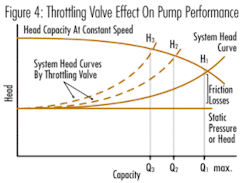
This process can also be repeated to develop system H-Q curves for other control valve settings as shown in Figure 4.
Now that we have the true current system H-Q curves we can use it to evaluate other energy savings options, such as impeller diameter trims, and alternate pump control methods, such as variable speed drives.
Ref: 1. “Centrifugal Pump Tests”, ANSI/HI 1.6-1994, Hydraulic Institute
About the Author:
Allan R. Budris, P.E., is an independent consulting engineer who specializes in training, failure analysis, troubleshooting, reliability, efficiency audits and litigation support on pumps and pumping systems. With offices in Washington, NJ, he can be contacted via e-mail at [email protected].
