Open Channel Flow Data Helps Determine "C" in CMOM
This article discusses a simple technique that allows water utility managers to determine both the Theoretical Capacity and Operational Capacity of a sewer system at flow metering points by displaying depth and velocity data in a scattergraph format. This is useful in complying with CMOM requirements. The article describes how to use scattergraphs to determine sewer capacity using Excel or any graphing tool.
By Patrick L. Stevens
The Capacity, Management, Operations and Maintenance (CMOM) requirements describe a best management practice for collection systems, but the capacity component of CMOM seems to fall short of its intended purpose. The term embodies both the concepts of Capacity Assessment and Capacity Assurance. Capacity assessment requires collection system managers to maintain an almost continuous awareness of the system’s capacity for dry and peak wet weather flows. The requirements however do not provide much guidance on how capacity is to be determined or monitored.
Many managers automatically turn to hydraulic modeling when capacity questions arise because today’s models are very effective at finding hydraulic restrictions in sewers and predicting areas of overflows or basement flooding. However weeks or months can be required to build a calibrated model and obtain the answers needed.
However, there is a very simple technique that allows a manager to determine both the Theoretical Capacity and Operational Capacity of a sewer at flow metering points by displaying depth and velocity data in a scattergraph format. This can take minutes instead of months. This article will describe how to use scattergraphs to determine critical answers on sewer capacity without the delays of modeling. In fact, modelers use these techniques to help fine-tune the calibration of models. This method can be used by anyone with Excel or any graphing tool, but the ADS software products of Profile, Sliicer.com, IntelliServe and FlowView Portal have these features built in.
Capacity Considerations
Every segment of sewer between manholes has three kinds of sewer capacity; Designed Capacity, As-built Capacity, and Operational Capacity. Designed Capacity is the calculated Theoretical Capacity based on a formula, usually Manning’s equation. As-built Capacity is the Designed Capacity of the segment minus any losses introduced during construction, such as out-of-grade pipe sections and poor exit conditions in manholes. Operational Capacity is the As-built Capacity of the segment minus any losses due to maintenance problems and deterioration due to aging. These losses can include roots, silt, offset joints, partially collapsed pipe, etc.
The ASCE Civil Engineering Research Foundation (CERF) estimates that 75% of the nation’s sewers function at less than 50% of their designed capacity. Operational Capacity is robbed by two categories of hydraulic loss. The first category is loss due to design and construction related problems. Design and construction related losses can be referred to as “parasitic hydraulic losses”, because the conditions causing them are always present and they derive their effect from the motion of wastewater itself. The second category of hydraulic loss consists of operational losses. These are generally recurring maintenance and deterioration problems that are temporary and resolvable.
Collectively, parasitic hydraulic losses, operational hydraulic losses, undersized pipes and undersized lift stations are all considered sewer “bottlenecks”. The concept of bottlenecks and how they contribute to sewer capacity is well understood. However, the difficult task facing collection system managers is to determine 1) where the below-capacity sewers are, 2) how far below capacity they are and 3) what condition is robbing the capacity.
Many managers believe that modeling is the best way to identify bottlenecks and capacity restrictions because it will determine the Designed Capacity of every sewer segment. But modeling by itself will identify only the bottlenecks that were designed into the system. A model cannot easily identify the capacity losses resulting from deterioration or poorly constructed structures. This type of capacity information is generated only through flow monitoring data. Skilled modelers seek as much flow monitoring data as possible to assure the model matches the actual system operation.
Using Scattergraphs
Historically, most users of open channel flow meters were in pursuit of the calculated flow rate and discarded the underlying depth and velocity readings. But a depth-velocity scattergraph from an open-channel flow meter is a great “Human Viewing Speed” graphic to reveal the hydraulic conditions in a sewer. Such a view can typically reveal both the Theoretical As-built Capacity and the Operational Capacity. It can identify a downstream restriction, whether it is a pump station, a treatment plant, or a problem with the pipe itself.
The information below will show how to use scattergraphs to recognize these hydraulic conditions: 1) Normal Flow, 2) Surcharged Flow, 3) Restricted Flow, 4) Restricted Flow with a Dead Dog and 5) a Downstream SSO.
Normal Flow
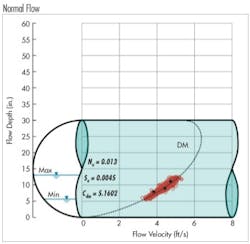
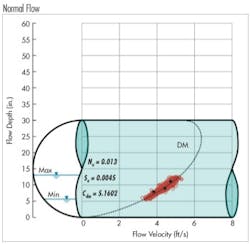
Here is a scattergraph from a sewer that is performing correctly. The red data points are the depth and velocity readings, the dashed line is the Manning pipe curve formed by the slope and roughness shown on the graphic. The ‘DM’ refers to Design Method and this is the design pipe curve of the sewer. The pipe curve is the depth and velocity relationship expected by the designer. The black diamond data points are manual confirmations for depth and velocity that confirm that the meter is operating without bias in either depth or velocity.
Surcharged Flow
This scattergraph is from a 42-inch sewer that operates in both open-channel (free flow) and surcharged (pressure flow) conditions. The data aligned with the pipe curve are collected during the free flow conditions and the data above 42 inches are collected during surcharge conditions. The addition of Iso-Q lines reveals the flow rate over the range of data. Iso-Q lines are lines of constant flow rate and are interpreted the same as elevation contour lines on a topographic map. The value shown on the Iso-Q line is the flow rate associated with that depth-velocity combination.
In this case the lowest night-time flow is 6.5 mgd, the highest dry day flow is 17.6 mgd and the pipe can carry 20.8 mgd when it surcharges. Notice that the flow rate is aligned with the 20.8 mgd Iso-Q line, which shows that pipe carries its Designed Capacity even when surcharged. This is not a common observation in real life. The ‘LC’ refers to the Lanfear-Coll method for fitting the Manning curve to the data without regard to slope and roughness.
Restricted Flow
A scattergraph can quantify the magnitude of the restriction with the use of Iso-Q lines. In this case the Iso-Q lines are labeled as a percentage of full-pipe capacity. The data from this 18-inch sewer follows the Lanfear-Coll line until a depth of around 10 inches. Above that depth, the data follow an Iso-Q line. Following an Iso-Q line is the characteristic trait of flow data from a sewer with a downstream restriction. The Iso-Q line that the data follow reveals the capacity of the restriction or the Operational Capacity of the sewer. In this case the Operational Capacity of the sewer is around 55% of its theoretical full-pipe capacity and that is surcharged to a depth of 70 inches.
Restricted Flow with a Dead Dog
A very common observation in scattergraphs is the presence of a ‘Dead Dog’, which describes the presence of any downstream object or condition that would result in a pool of water at the metering site if all flow stopped. In this case the sewer is operating with a Dead Dog of 6.45 inches. This could be the result of silt, debris, off set joints or a negative grade pipe section downstream of the meter. This pipe curve is created by the Stevens-Schutzbach method (‘SS’) and the series of dashed lines show the iterative process that is used to fit a Manning curve to the data at various Dead Dog depths. This view of the data allows collection system managers to evaluate the effectiveness of cleaning programs, because the Dead Dog will disappear if it was caused by silt or debris.
Downstream SSO
This scattergraph shows that the 27-inch pipe operates normally up to depths of 15 inches and at greater depths moves into backwater due to a restriction. The Iso-Q lines reveal the pipe is restricted to 50% of its carrying capacity (8.9 mgd of 18 mgd). The pipe surcharges to a depth of 65 inches at which time a downstream overflow occurs indicated by the increase in velocity at the constant depth of 65 inches. The depth is controlled by the elevation of the overflow point and the velocity increase is due to the extra water passing by the meter as it escapes the system. The flow rate out the SSO can be calculated by the increase in velocity at the overflow elevation and in this case the downstream SSO discharged at peak of 1.6 mgd.
Conclusion
Some agencies collect flow data for many years and are never aware that this type of information and insight exists in flow data. Some collection systems managers are ‘reactive’ in their planning and their capital plans and management decisions are made with little reliance on flow data. Some managers will gather flow data only because they are forced to by enforcement action or they will calibrate a model and never learn how to use its additional value as a management tool.
The use of scattergraphs in collection systems is relatively new and is dependent on reliable depth and velocity metering technology. ADS has pioneered the use and interpretation of scattergraphs in collection systems and several new intelligent features in ADS’ monitors and software are based on scattergraph knowledge. For more information on scattergraphs and how to understand them, check out the information at www.adsenv.com/scattergraphs. Technical papers with information on the pipe curves discussed here can be found at www.adsenv.com/techforum.
WW
About the Author: Patrick L. Stevens, P.E., Vice President of Engineering, ADS Environmental Services, has 20 years of experience with ADS and over 40 years of professional experience in the field of collection systems engineering. Stevens is formerly a Director of Public Works. In his current role at ADS he has worked with numerous cities and engineering consultants to develop and deliver innovative flow monitoring programs for design, modeling, and rehabilitation of sanitary and combined sewers. He holds a BS in Aeronautical Engineering and an MS in Environmental Engineering from Purdue University.
More WaterWorld Current Issue Articles
More WaterWorld Archives Issue Articles

