Staying in the Proactive Zone
The water industry continues to face many difficult challenges. These include finding a balance between sustainable utility management strategies and resources and investment needs to maintain infrastructure properly. As a utility manager, you need to know your utility’s current performance status to effectively manage it and proactively address any management- or maintenance-related pressures.
Today, very few utilities are solvent enough to tackle all their needs immediately; even prioritization based on largest needs is not enough to address issues while avoiding complaints and scrutiny. One way to make sure that you, as a utility manager, are not out of touch in planning your resources is by looking at what other similar utilities are doing. A utility-specific benchmarking study allows you to compare your utility’s performance with other similar utilities in the region. By knowing your utility’s current performance status, you can develop a strategy for improving your programs to stay among the league of successful utilities.
Why Benchmark Your Utility?
Benchmarking is a fundamental practice used to gain factual insight and obtain a clear understanding of performance gaps to drive change initiatives and produce a higher performance level in any organization. Each year, the American Water Works Association (AWWA) updates its benchmarking survey data using nationwide utility participation and develops statistical parameters for various performance categories. These benchmarks are national averages and may not be utilized to measure the performance status of a local and unique utility. For example, issues and concerns of a utility in Richmond, Va., may not be similar to those for a utility in Phoenix, Ariz. A more useful approach would include benchmarking your utility by comparing its performance against the performances of peer utilities with similar size and characteristics located in the same geographic area.
By using utility comparison data and reviewing performance against industry standards and guidelines, proactive utilities can conduct their own benchmarking surveys, allowing them to make informed decisions when creating their maintenance and management goals and programs.
The Benchmarking Process
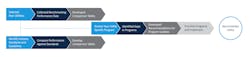
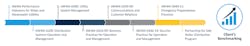
A typical scope for a utility-specific benchmarking process consists of structured steps.
- Comparison of utility-performances against same for other utilities and industry standards
- Development of comparison matrices to identify gaps in benchmarked performances
- Development of a list of recommended improvement needs to reduce the gaps
- Prioritization of improvement program list for implementation
Comparing your utility-performances against performances of other utilities and industry standards needs selection of peer utilities, collection of performance data from these utilities, and development of comparison tables for various performance categories. This process allows you to identify performance gaps, such as missing programs and tasks. Once the gaps are identified, you can create a list of improvement needs. It’s essential to involve key stakeholders and decision-makers in brain-storming sessions and workshops through which you can combine the improvement projects into multiple, more manageable programs and prioritize them.
Selection of Peer Utilities
Selection of peer utilities should be based on characteristics similar to your utility. These characteristics include the system’s size and age, the population and customer served, and a general understanding of issues such as finances, staff levels, source water, and other-enforced regulatory environment. You will need extensive communication with the peer utilities to gather data and understand what is behind the numbers. Your project’s success is dependent on the data, so it is vital to have a trusted partner at each of the peer utilities you work with.
Data Collection, Compilation, and Comparison
After selecting peer utilities, you have to define the performance categories to benchmark your organization and system. You can use AWWA’s benchmark survey categories as your base and add or remove items based on your needs. You will then coordinate with peer utilities to collect and compile data on these categories. This is the most critical and time-consuming step. Managers and operators are busy, and the peer utilities are voluntarily providing the data. As you further investigate the data, you must be cognizant about the time it may take to gather data and receive answers to your questions. Reviewing supporting documents will help to gain confidence in the data.
You will be dealing with data that can vary depending on how the utilities define the categories. Your definition of a category may be different than that of a peer utility. For example, suppose your utility serves only the customers within your corporate boundary. In that case, you need to make sure that your peer utilities are not including wholesale customers in their customer numbers. By developing a detailed questionnaire, you can properly manage the definitions and categories to make appropriate comparisons.
Development of Utility-Performance Comparison Tables
Graphs and charts are useful in benchmarking analysis; they provide you with visuals to compare the data and help your team of key decision-makers understand your utility’s status. This also allows them the opportunity to identify additional investment needs in gap areas to improve performances in various categories.
Once you gain confidence in the data, you can compile the data in an organized, tabular format, categorized and sub-categorized into detailed levels. Each of these tables can hold multiple data categories and sub-categories. For example, in Virginia, the City of Richmond completed a benchmarking study for its distribution system where the city developed five tables to represent its distribution system benchmarking categories: system characteristics, utility organization, operations and maintenance, performances, and finances. The operations and maintenance table included sub-categories such as planned and reactive maintenance, break and leak repair data, condition assessment data, or repair and replacement data. Each of these sub-categories was further divided into detailed levels. For example, the planned and reactive maintenance sub-category included the number of hours for planned maintenance activities, number of hours for corrective maintenance activities, total maintenance budget, total maintenance budget as a percentage of the utility’s budget, and planned and corrective maintenance expenses for the year. These detailed tables helped to review the system holistically and identify areas the city wanted to investigate further.
Review Performance against Standards and Guidelines
The next step is to determine the standards and guidelines available or developed by industry-leading organizations. For example, in its distribution system’s benchmark analysis, the City of Richmond reviewed AWWA’s G series standards and the Partnership for Safe Water’s guidelines on distribution systems operations, maintenance, and management activities. Eight comparison tables were developed to compare current activities and programs against the listed guidelines. Using a similar approach allows you to visualize the absence of a program and identify gaps in your existing programs. In most cases, you will find that your utility may be already conducting most of the recommended activities with some missing categories. Knowing what you are doing right is as important as knowing what you are missing.
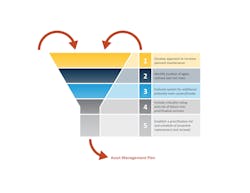
Observation, Recommendation, and Prioritization
Comparison tables can be used to identify areas and categories where your utility is either missing a program or has gaps in the existing programs. Based on the observations, you can develop a list of improvements that you want to execute. This list can be examined from a holistic point of view, and categories can be combined to develop more manageable programs.
Once you develop a strategy to optimize your programs’ effectiveness, prioritize the updated programs based on the urgency of various competing needs.
Conclusion
Benchmarking is a valuable tool that can be used to start your planning and strategic decision cycle. Through the benchmarking process, a utility can track its current status and progress toward improving its overall performance. A benchmarking study helps a utility manager recreate successes achieved by peer utilities and prevent others’ pitfalls.
Benchmarking analysis should follow the planning cycle and should typically be conducted every four to six years to help support your long-term capital management and planning activities. WW
About the Author: Aziz Ahmed, PE, is a chief engineer at CHA Consulting Inc., providing technical and client service management oversight for water and wastewater infrastructure projects. His expertise includes performing and directing engineering services related to water resources and water utilities, including comprehensive water and wastewater infrastructure planning; modeling and management projects; utility master planning; long term control planning; preparation of capital improvement programs, water quality and process review and analysis; and infrastructure design. He can be reached at [email protected].
About the Author

Aziz Ahmed
Aziz Ahmed, PE, is a chief engineer at CHA Consulting Inc., providing technical and client service management oversight for water and wastewater infrastructure projects. His expertise includes performing and directing engineering services related to water resources and water utilities, including comprehensive water and wastewater infrastructure planning; modeling and management projects; utility master planning; long term control planning; and preparation of capital improvement program, water quality, and process review and analysis, and infrastructure design. He can be reached at [email protected].