Get Smart: Advanced Metering Means Wiser Rates and Consumers
By Sue McCormick and Wendy Welser
Smart metering is getting plenty of publicity for electric utilities these days, and the “smarts” extend well beyond the meters. Consumers gain opportunities to learn about their electricity consumption and use power more wisely. Rate design gets savvier, also. Most electric utilities with smart-grid deployments are considering rates aimed at lowering peak demand to avoid or delay capital investments.
Such uses for advanced meters haven’t been as common at water utilities, but with infrastructure reaching capacity, that will likely change. In Ann Arbor, MI, the city’s water utility implemented a STAR Network advanced metering system from Aclara in 2005. The benefits of this implementation and the data collected have resulted in more informed consumers, smarter rates for demand management, better utility planning and more.
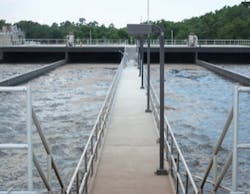
Figure 1: The picturesque Huron River runs through Ann Arbor, but utility officials say they can’t withdraw all the water allowed by their permit without impacting wildlife and river recreation. Demand management helps prolong resource availability. Photo: Jane Reading.
On Demand
Back when the term “smart grid” was first gaining popularity, the issue driving its development was capacity. After decades of under-investment in infrastructure, electric utility professionals realized they’d either need far more power infrastructure — such as plants and lines — or less peak consumption.
Today, many water utilities face similar problems. Ann Arbor experienced near drought conditions in the summer of 2003, just about the same time the utility was in the final planning phase for an advanced metering project. That year, the system approached a peak of some 38 million gallons per day, or almost 80 percent of total capacity, a point at which the Michigan Department of Environmental Quality (MDEQ) would have required preliminary studies showing how the utility would extend system capacity.
Figure 2: More than 100,000 fans pack the University of Michigan’s “Big House” during a football game. The resulting demand put on the local water utility earns Michigan Stadium higher rates under Ann Arbor’s “cost-of-service” pricing scheme. Photo: UM Photo Services, Martin Vloet.
Unfortunately, there are no cheap, easy-to-reach sources for additional water within the city limits, making it very costly to expand the current system capacity. Unlike many communities in Michigan, Ann Arbor does not have access to water from the Great Lakes. And, although there is a river running through the city, studies show that if the utility were to withdraw all the water allowed by its permit, it would prove detrimental to the ecosystem, as well as to the quality of life enjoyed by people who use the river for recreation.
Although groundwater is accessible to the community, it isn’t well protected by the local geology, which allows chemicals and biological contaminants to penetrate groundwater resources. For this reason, all well fields within the city limits are currently out of service. Consequently, the next well field installed is likely to be some distance away from the city, making it a very expensive source for raw water. That’s the type of water-resource investment that the utility is hoping to forestall through demand management.
Demand management strategically uses rates, technology and customer education in ways designed to get consumers to shift consumption to off-peak hours or reduce it overall. The goal is to flatten the system peaks that could force a utility into the kind of capital investment necessary to serve customers on maximum-capacity days. Although there are capital investments ahead for Ann Arbor, rates will be raised gradually to cover them.
Paying the Freight
Electric utility professionals often consider demand-management strategies. These include time-of-day rates or load-interruption technologies, such as switches on air conditioners that empower the utility to turn off the compressor when peaks threaten the system.
Until recently, however, demand management hasn’t translated to the water utility industry — but it will. Utilities have reached a point where infrastructure needs will force water providers to consider such measures or quickly raise rates.
Ann Arbor’s approach to demand management has focused on both education and pricing, with emphasis placed on “cost-of-service” pricing. Though Ann Arbor’s environmentally conscious customers might be accepting of a goal to promote conservation by raising rates, the utility’s prices actually reflect the real cost of usage. The more water used during the peak season, the more it costs to provide.
Consequently, Ann Arbor implemented tiered rates for residential-class customers, and those rates were based on a study of system costs and typical residential usage patterns. Some of the elements examined included:
- The volume of water used and assets required to deliver it
- Maximum-day and maximum-hour demand, as well as what went into serving that demand
- Metering costs
- Billing and collection costs
These elements draw an important distinction between fixed costs and consumption rates. Metering, billing and collection costs are fixed and unrelated to volume of usage. As a result, these costs are recovered via a “customer” charge, and they make up no part of the per unit consumption rates that are charged according to levels of usage.
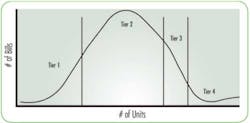
The lowest residential rate, or Tier 1, was designed to cover the actual cost of a unit of water without burdening low-volume users. Tier 2 is the “sweet spot,” or bulge in a bell curve. It represents the consumption for an average customer, a family of about three people. Tier 3 might reflect some irrigation usage, while Tier 4 reaches only a small minority of customers with very high consumption.
For most residential users, the rates range from $1.10 per 100 cubic feet (748 gallons) in Tier 1 to $5.24 per 100 cubic feet in Tier 4. Customers only pay the higher rates on the consumption that exceeds the boundary from one tier to the next.
The reasoning behind these rates was simple: Consumers make choices about how they use the system, and those choices drive utility costs. Using lots of water during the peak season is fine if you’re willing to pay the “freight,” meaning the costs associated with producing that water.
As a result of the rate change, customers made different choices. The utility’s maximum day went from 38 million gallons in 2003 to 22 million gallons in 2006.
Figure 3: Ann Arbor’s initial effort at cost-of-service rates, implemented five years ago, based rate tiers on recovering the average cost per unit in “demand” blocks. The city graphed the number of bills at each unit of commodity and found that it formed a perfect bell curve.
Driving Decisions with Data
It is possible for a water utility to implement tiered rates like Ann Arbor’s without advanced metering. What isn’t possible is making consumption data directly available to consumers to help them manage their costs within the rate structure.
Since 2007, Ann Arbor has offered its customers extensive usage data online via a Web browser application. Customers can see their current bill, how much water they’ve used, how that compares to previous usage and more.
Because two readings are collected on each account every day, the system lets customers check their consumption, irrigate the lawn, then check the next day’s consumption to learn just how much water they’re using with each cycle of the sprinkler system. Reviewing this type of information in advance of receiving the next bill enables a customer to estimate how much their next bill might be if they continue using water in the same fashion. This empowers customers to make informed usage decisions.
Charging for Peak Usage
The presumption with residential customers, based on national resource data, is that high usage corresponds with system peaks. For commercial and industrial (C&I) customers, the utility knows when that’s the case, because the metering data make it clear.
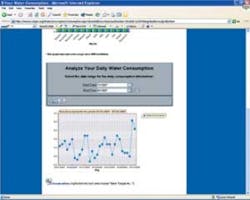
Figure 4: In addition to monthly and quarterly usage, customers can graph their daily usage and download it into a spreadsheet for further analysis. Providing detailed data allows customers to make better decisions on water use and encourages conservation.
In fact, Ann Arbor has tracked daily usage for each C&I account, calculated the average daily usage, and identified each customer’s top three days during the peak usage period from May to October. The highest two days are discarded, and the third is used to calculate a peak-to-average usage ratio for each C&I customer. The ratio is then used to assign each customer to the appropriate rate tier.
C&I customers in Tier 1 show little difference between their peak and non-peak usage. Those whose peak usage is between five and eight times more than their average daily demand are charged Tier 2 rates. If peak usage is more than eight times greater than average daily usage, the customer is assigned to Tier 3. The rates rise from $2.60 per 100 cubic feet (CCF) in Tier 1 to $4.90 per CCF in Tier 2 to $8.39 per CCF in Tier 3.
Figure 5: Ann Arbor water customers can analyze changes in usage patterns over various time periods. Results can be graphed to make it easier to understand how use patterns may have changed.
Although Ann Arbor anticipates that C&I customers will reduce peak usage and smooth out their usage patterns because of the rates, it is too early to tell. The C&I program was initiated in July 2008 with 60 customers for whom 12 months of data were already available. All 3,000+ C&I accounts will be assigned to a tier for the coming rate year beginning July 2009.
Even if C&I customers don’t change their usage behavior, the peak-to-average rates are designed to bill customers fairly. Ann Arbor knows that more treatment-plant and water-resource investments are needed in the future. Cost-of-service rates are designed to assure fair distribution of expenses associated with those future investments.
About the Authors
Sue McCormick is Water Utilities Director for the city of Ann Arbor, MI. Wendy Welser is the Customer Services Manager for the city of Ann Arbor, MI.


