Manage Energy, Reduce Demand With Real-Time Information
By Larry Dees, Philip Lawler, Ronin Goodall, Greg McDowell, Brad Daley, Nolan King, Thomas B. Neary
One of the most overlooked costs in water system design and operation is the electrical demand charge, which can spike to high monthly levels when operators turn on extra equipment to maintain water system reliability during an outage or unplanned emergency.
What is an Electrical Demand Charge (Cost)?
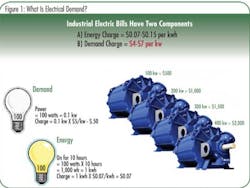
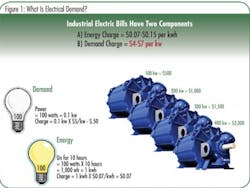
Electric bills have two core parts — generation charges and demand charges. The generation charge is the cost to make the electricity, while the demand charge is the cost to deliver the electricity to the customer’s place of service. Generation charges reflect the stable, ongoing kilowatt-hour (kwh) costs required to operate the plant and typically range between $0.07 and $0.15 per kwh. Demand charges reflect the need to pay for the power cables, transformers and other electrical distribution equipment that deliver each additional kilowatt of electricity to the customer, and typically range between $4 and $7 per kw each month.
At $0.07/kwh, the generation charge for a 100 kw (134 hp) pump that runs for 100 hours is $700. The monthly demand charge for that same pump at $5.00 per kw would be $500, giving a total bill of $1200.
Figure 1. FAQ from MNWD’s knowledge management system.
Now imagine that a one-hour maintenance check is carried out on a second identical pump. It incurs a generation charge of just $7 for an hour’s operation. But with both pumps running at the same time, the maximum kw demand now rises to 200kw, doubling that month’s demand charge from $500 to $1000. The total bill for the month would rise to $1707.
That single hour of operation increased the total electrical bill for the month by a third! In comparison to water pumped, a 1% increase in water pumped has created a 42% increase in the electrical bill. And yet if the operator had first stopped pump number one and then started pump number two, the maximum demand would have stayed at 100kw for that month and the bill would have only gone from $1200 to $1207.
Water systems are designed and overpowered for safe and reliable delivery of water. It is very easy for an operator who is unknowledgeable about energy management to inadvertently create massive spikes in electrical demand — making a costly purchasing decision just by starting a pump.
It only gets more complicated from here. Electric utility Time of Use (TOU) rate schedules separate demand charges into peak, off-peak, semi-peak and sometimes critical-peak, incentivizing customers to shift their consumption to periods of lower demand on the grid as a whole. Often there are two (occasionally three) separate electric utility providers for maximum water system reliability, and each utility has different rate schedules and demand charges. But the good news is that, unlike electricity, water can be stored. Water utilities that can change operations without sacrificing operational reliability are the perfect demand response partners for an electric utility.
Electric Utility Demand Response Programs
In today’s water utility electrical demand only continues to grow. Population growth and the limited amount of water are forcing utilities to invest in electrically inefficient water technologies such as ozone generation and desalination. To offset their rising electrical demand, some utilities are investing in renewable energy operations.
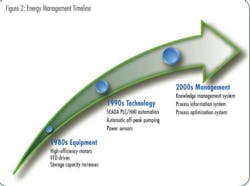
Figure 2. Timeline of energy management at MNWD.
At the same time today’s electric utility demand charges have evolved to play key roles in what are now called Demand Response Programs. Utilities will lower the demand charges if they can interrupt service whenever the load on the electrical grid reaches a critical peak. During periods of critical peak demand these new “Interruptible” rate schedules are being used to shed large customer loads and also to encourage large customers to reduce their maximum demand.
Demand response differs from Time of Use (TOU) rate schedules, which encourage customers not to reduce maximum demand but to shift their demand to other periods of the day. Electric utilities have identified demand response programs as a potential way to reduce the requirement to build thousands of peaking power plants in the future.
Moulton Niguel Water District
Moulton Niguel Water District (MNWD), located in Orange County, CA, has no source water of its own and relies on the Metropolitan Water District of Southern California as its sole wholesale water source. MNWD’s water distribution system is composed of separate potable and recycled systems. The geographic water service area is hilly with multiple pressure zones.
Like many water agencies in the 1980s, MNWD began making investments in passive energy management technologies. The District upgraded to high-efficiency motors, installed variable frequency drives and expanded water storage for off-peak pumping at night when power is cheaper.
Over the past twenty years, investments in automation have delivered more accurate control of off-peak pumping systems across more than 70 pump stations. In the last five years MNWD has invested in operational knowledge management and plant information systems that allow the operator to make “active” energy management choices.
Operational Knowledge Management
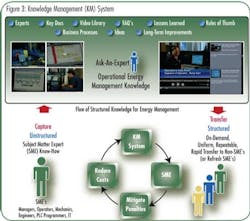
Online knowledge management systems enable groups to establish a continuous improvement loop where operations are changed, new rate schedules are adapted and lessons are learned. This new operations knowledge is updated in the knowledge management system for accurate and rapid transfer across all energy management stakeholders. The prime directive is safe, reliable water service, and the secondary objective is energy efficiency.
MNWD’s knowledge management system documents operational processes using videos of both standard operations and energy management business processes. This operational knowledge is cataloged along with energy management data in the form of frequently asked questions (e.g., “What is a Demand Charge?”), pump curves, efficiency tests, energy management reports, rate schedules, lessons learned, ideas and long-term improvements. Knowledge that was siloed in the minds of both the operations and energy management experts is pushed out across the desktops and mobile devices of all the energy management stakeholders.
As new rate schedules are communicated by the electric utility company, operations are reviewed. Operational changes are implemented, SCADA program changes are made and the new rate schedules are signed. The new operational knowledge is added to the online energy management catalog. This process continues and the catalog enables the stakeholders to quickly acquire the new knowledge they need or refresh the knowledge that they may have forgotten.
Plant Information System
Process information systems are the most robust way to monitor water system energy usage without having to wait for the bills to come in every month. One of the most important data elements is the electrical cost per acre-foot of water ($/acre-foot). Monitoring dollars per acre-foot is challenging since it means reconciling flow data extracted from control systems with transactional billing system data recorded in accounting systems.
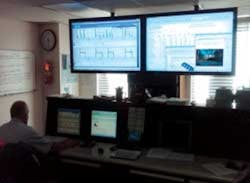
Figure 4. MNWD control room, SCADA and process information systems.
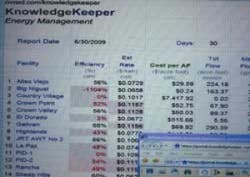
MNWD set up a live energy management report to provide continuous data feeds. On the left side the operator monitors efficiency and the process sensors that make up efficiency, flow, pressure, power and maximum demand in kw. On the right side the operator monitors estimated and actual billing information with a clear focus on estimated rate in cents per kwh.
Quickly the operator can see the efficiency, the current month’s maximum power demand and the estimated rate. Efficiency issues arising from sensors, software, or equipment are easily managed by alarming when a station’s efficiency drops below 60%.
Figure 5. FAQ from MNWD’s live energy management report.
Estimated rates in the live energy management report are high at the beginning of each month because the demand charge is immediately assessed by the process information system. The longer the pump runs that month the more the demand charge is minimized. The objective is to visually show the operators the energy impacts of their decisions. When a second or even a third pump needs to be started, the plant information system shows the operator the estimated energy cost of those decisions in real time and the previous monthly history.
Energy Management Results
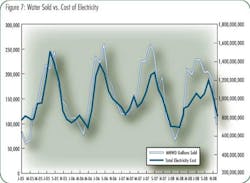
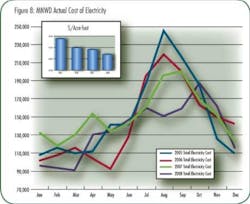
Active Energy Management using these tools yields impressive results. At MNWD, year after year increases in total water sales occur but energy expenses are slightly decreasing. This is clearly documented over a three-year period (2005, 2006 and 2007) until the drought in Southern California started to reduce water sales in 2008.
The energy management investment in the knowledge management system began in 2005. By 2006, operators armed with the new demand response knowledge were already navigating around the high electrical demand costs. The results continued to improve, reaching new levels of cost savings in 2007.
In 2008 the plant information system was brought on-line and new interruptible rate schedule contracts were signed with one of two electrical utilities. The peak summer month demand costs that used to spike in 2005-2007 have essentially flattened in 2008.
It is crucial not to depend solely on ‘critical peak’ contracts to reduce demand costs. Such contracts carry risk because if the electric utility is unable to interrupt operations during critical peak periods then the customer will incur high penalties.
Many of MNWD’s demand costs were reduced by changing operations in 2006 and 2007. MNWD did not enter into interruptible contracts until 2007. Now that all the stakeholders involved have intimate operational knowledge and are working as a group to change plant operations, the risk of incurring penalties from the electric utility due to an operational miscue is substantially mitigated.
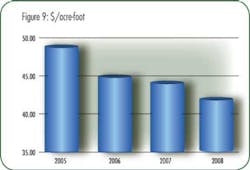
MNWD’s electrical cost per acre-foot or water was almost $48 in 2006. Active energy management has reduced the cost to $42 per acre-foot, a 20% reduction. With an annual electricity cost of $1.5M - $2.0M per year, active energy management investments are enabling MNWD operations staff to save $200,000 to $400,000 in annual electricity costs.The Future of Energy Management at MNWD
Using operational knowledge and plant information systems, MNWD operators are continuously adjusting water system operations for efficiency and lowest electrical demand state. An area for additional improvement would be a closed-loop pump scheduling system that trims automatic pump call (on/off) levels to further manage energy.
Renewable energy sources are also under consideration. Due to the number of solar panels required, it is not feasible to set up a solar array that could power every pump at a pump station. However, operators are now more adept at making the most out of one pump. For a station with three pumps, a single-pump solar array would eliminate 30% of the station’s maximum power demand. With non-demand response contract prices rising toward $10 per kw, it is becoming more viable to use renewable energy to further reduce electrical demand.
Figure 9. MNWD staff are continuously reducing the dollars per acre-foot.
In the future, making energy will reinforce the knowledge that operators use to manage the energy they purchase, giving operations staff another knowledge area to work with and greater self-sufficiency during emergency operations.
About the Authors
Larry Dees, P.E., is Director of Operations for Moulton Niguel Water District. Philip Lawler is Facilities Manager for Moulton Niguel Water District. Ronin Goodall is a System Operator Supervisor for Moulton Niguel Water District. Greg McDowell is an Electrical/Instrumentation Services Supervisor for Moulton Niguel Water District. Brad Daley is a Systems Analyst with Moulton Niguel Water District. Nolan King is a Systems Analyst with Moulton Niguel Water District. Thomas B. Neary, P.E., is President of OpCon Technologies, Inc. (San Francisco, CA).
