Getting Dual Use Value From Water Security Monitoring Systems
By Dan Kroll and Karl King
The distribution system represents the last analytical frontier in the water quality industry. The monitoring of source water and treatment plant processes has progressed to a level at which we can be confident that we are providing good quality water from the plant to the distribution system. Once the water reaches our aging distribution systems, however; our knowledge as to its continued integrity is limited by the quality and amount of available data. Most monitoring in the distribution system is relegated to the occasional snapshot provided by grab sampling for a few limited parameters or the infrequent regulatory testing required by mandates such as the Total Coliform Rule in the US. The development of water security monitoring in the years since 9/11 has the potential to change this paradigm.
Since 9/11 numerous communities have installed multi-parameter monitoring stations in various locations through out the distribution network as early warning systems to detect potential water security threats. These continuous on-line systems have recorded large streams of data (at some sites for a number of years) relevant to water quality in the distribution systems in which they have been deployed.
For the past several years, scientists at Hach Homeland Security Technologies (HST) have been actively engaged in the development and testing of an early warning system for detecting water quality problems including those related to an intentional terrorist attack. This paper gives a brief summary of how the developed system operates and presents results form some of the recent field-deployment efforts that have been undertaken.
In this study, data streams from a number of communities (both small and large) are analyzed for pertinent information as to the health and operation of the distribution system. Changes in water quality are correlated with known causes attributable to day-to-day operational changes and also anomalous events. Case study information concerning what, if any, action was taken to ameliorate the problem will also be reported for the identified events.
This sort of information is critical in understanding and improving the operation of our distribution systems and can also be valuable as we consider regulations that affect that operation. Any future efforts to regulate the distribution system will need to consider databases and monitoring techniques such as the one described here before we can determine the best course of action to ensure our public water supplies meet acceptable levels of quality and safety from source to tap.
The Hach Method and Approach
Monitoring in the distribution system is a difficult proposition. The shear number and diversity of potential threat agents that could be utilized in an attack against the system makes monitoring for them on an individual basis an effort that is doomed to failure. To counter and detect the unprecedented number and types of compounds that may be encountered, what is needed is a broad-spectrum analyzer that can respond to any likely threat and even unknown or unanticipated events.
Rather than attempting to develop individual sensors to detect contaminants, the Hach HST approach was to utilize a sensor suite of commonly available off-the-shelf water quality monitors such as pH, electrolytic conductivity, turbidity, chlorine residual and total organic carbon (TOC) linked together in an intelligent network. The logic behind this approach is that these are tried and true technologies that have been extensively deployed in the water supply industry for a number of years and have proven to be stable in such situations. One of the difficulties encountered when designing such a device is that the normal fluctuations in these parameters found within the water can be quite pronounced.
The problem then becomes, can we differentiate between the changes that are seen as a result of the introduction of a contaminant or anomalous condition and those that are a result of normal everyday system perturbation? The secret to success, in a situation such as this, is to have a robust and workable baseline estimator. Extracting the deviation signals in the presence of noise is absolutely necessary for good sensitivity. Several methods of baseline estimation were investigated. Finally, a proprietary, patented, non-classical method was derived and found to be effective.
In the system as it is designed, signals from 5 separate orthogonal measurements of water quality (pH, Conductivity, Turbidity, Chlorine Residual, TOC) are processed from a 5-paramater measure into a single scalar trigger signal in an event monitor computer system that contains the algorithms. The signal then goes through a crucial proprietary baseline estimator. A deviation of the signal from the established baseline is then derived. Then a gain matrix is applied that weights the various parameters based on experimental data for a wide variety of possible threat agents. The magnitude of the deviation signal is then compared to a preset threshold level. If the signal exceeds the threshold, the trigger is activated.
The deviation vector that is derived from the trigger algorithm is then used for further classification of the cause of the trigger. The direction of the deviation vector relates to the agents characteristics. Seeing that this is the case, laboratory agent data can be used to build a threat agent library of deviation vectors. A deviation vector from the monitor can be compared to agent vectors in the threat agent library to see if there is a match within a tolerance. This system can be used to classify what caused the trigger event. This system can also be very useful in developing a heuristic system for classifying normal operational events that may be significant enough in magnitude to activate the trigger. When such an event occurs the profile for the vector causing it is stored in a plant library that is named and categorized by the system operator. When the event trigger is set off the library search begins.
The agent library is given priority and is searched first. If no match is found, the plant library is searched and, the event is identified if it matches one of the vectors in the plant library. If no match is found, the event is classified as an unknown and can be named if an investigation determines its cause. This is very significant because no profile for a given event need be present in the libraries for the system to trigger. This gives the system the unique ability to trigger on unknown threats and events. Also, the existence of the plant library with its heuristic ability to learn plant events results in a substantial and rapid decrease in unknown alarms over time and offers a tool for system optimization. The developed system has been subjected to strenuous testing in both laboratory and field scenarios. This has resulted in this approach being the only water quality monitoring system listed by the US Department of Homeland Security as a designated and certified antiterrorist device under the US SAFETY Act.
Field Testing of the Developed System
Prior to the onset of this project, there was a definite lack of data concerning conditions in the distribution system. Very few utilities carried out data collection in the distribution system other than periodic grab samples. Those that did have some on-line continuous data were usually limited to only one or two parameters.
Since the initiation of this program over, 500,000 hours of real time data has been collected across a wide variety of different distribution systems exhibiting different water matrix profiles revealing many interesting attributes of the distribution systems. These systems represent a variety of water quality conditions and operational situations. The site locations need to remain anonymous due to security considerations and non-disclosure agreements, but they represent a wide diversity of system sizes and geographic locations throughout the United States.
The deployments are at both civilian and military sites. At the time of the preparation of this article, all deployments are within the United States. Hach HST has only recently received International Traffic in Arms Regulation (ITAR) clearance from the US Department of State to deploy the systems on an international basis. The following are a few examples of incidents that have been recorded during these real world deployments. These incidents help to demonstrate the systems ability to learn and to become a useful tool not just for security but also for every day operational improvements.
Caustic Overfeed Event
In this deployment scenario, the plant uses caustic feed to control water pH. The system experienced a trigger that when investigated was identified as an operational problem that resulted in the feed of excess caustic. The result was that the overfeed affected the pH and the conductivity of the water, causing the alarm. See figure 1.
The reason behind this was that the vendor from which the casuistic was being purchased had delivered the wrong concentration of the solution. No one had checked to see if the concentration was correct before feeding in the material. New procedures were put in place to verify incoming raw materials. The Event Monitor learned this Plant Event and can identify a recurrence of the event in the future if there is another failure in the system and it is repeated.
Road Work Event
In this event, roadwork (jackhammers) near a distribution line dislodged biomass and other particulate matter from the lining of the pipe. There was a massive increase in turbidity, which not only showed up on the turbidimeter, but also showed up as an interference in the chlorine measurement (optical). As expected, the conductivity and pH also showed minor changes. The increase in biomass in the water was indicated by the TOC analyzer. This event illustrates the ability of the Event Monitor to detect and alarm on unanticipated events. This event also provides a signature for the materials adhering to the walls of the pipes in this location and should recognize any future excursions of this type.
Pressure Event
In this scenario, the system was located in a building, which experiences a daily variation in water pressure. The sample variation is associated with a turbidity increase that causes a Trigger. There is also a small pH decrease at that time, possibly because of increased solubility of CO2 in the water, dropping the pH slightly. After recognition of the cause and proper naming of this pattern, it is recognized by the Event Monitor as a "Normal" event, rather than an alarm condition, and appropriately classified and named as such.
Rain Events
Large amounts of rain fell in the area of a reservoir, raising turbidity and affecting other water quality parameters. These events were large enough to cause a Trigger. The system was able to store this pattern and recognize it upon recurrence.
Effect of Variable Demand
In this deployment, daily events influencing turbidity, chlorine, pH and conductivity are not completely understood but were suspected to be caused by water demand fluctuations in the area. This may indicate a need for more routine flushing of the areas pipes and the instillation of a chlorine booster station.
Ammonia Overfeed Events
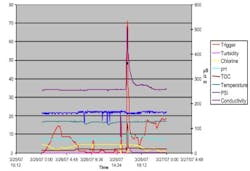
On March 26th, 2007, maintenance was performed at the plant supplying water to the distribution system being monitored. After the maintenance was completed, the plant was restarted and the system that feeds ammonia to create monochloramine as a residual disinfectant overfed the chemical. The person in charge of the on-line monitors immediately noticed the increase in pH and notified plant operations. Operations reported a problem with ammonia feed pumps. The problem was temporarily fixed, but a slug of ammonia was sent into the distribution system. Several customers called, complaining about an ammonia smell and taste coming from the tap. The exact amount of ammonia released was unknown, but was believed to be less than 10 ppm. The facility continued operations but temporarily switched to free chlorine as a disinfectant until July 2nd. See figure 2. On October 3rd, the same treatment plant experienced a brief ammonia overfeed. In this case, a pump was turned on and not switched off at the proper interval. There was a drop in chlorine and a decrease in pH.
Between August 22 and August 23, 2007, three similar events occurred. Increases in turbidity pH and possibly TOC with drops in chlorine caused triggers. These changes resemble the large ammonia event that occurred in March. The operator believes that these could be ammonia feed events, but could not confirm it or find the fault.
Possible Chlorine Feed Event
An April 3rd, 2007 there was a turbidity and pH increase and a decrease in chlorine and conductivity. The operator suspects that there was a problem with the chlorine feed at the plant. However this cannot be confirmed. The plant was using free chlorine at the time which rules out the possibility of an ammonia feed problem.
Air Bubble Event
In one Northern Midwestern city's distribution system, every Friday, the deployed sensors would behave extremely erratically resulting in multiple alarm signals being generated. Investigation led to the discovery of extreme amounts of entrained air bubbles being present in the system's water on Friday afternoons and evenings. Further investigation into the root cause of the air bubbles being present revealed that school buildings in the area that were to be vacant over the weekend had a policy of using air to blow out their water lines to prevent freezing so that the heat could be turned off over the weekend and holidays. A faulty check valve at one of the schools allowed the air to bleed into the distribution system. The valve was replaced, thus closing a possible backflow route into the system. After this maintenance was performed, the erratic readings ceased.
Distribution Flushing Case Study
In this case, the water utility customers were experiencing poor water quality in certain areas of the distribution system. The systems operations team could not pinpoint the problem. A series of distribution system monitoring devices were installed at various locations throughout the distribution network. The devices were able to help in locating a number of transient dead ends and low flow areas based on the monitoring results. Using this data the team revised the normal flushing schedule for these areas. The results were improved water quality and fewer customer complaints.
Grab Sample Versus On-line Case Study
In this situation, the local water utility had in place an extensive system of water monitoring through grab samples. All indications were that the water quality was good. After installation of several water monitoring panels in the distribution system they found that the turbidity spiked to levels as high as 20 NTU during the night and early morning hours when typically no grab samples would have been collected. They also found extremely high variability in chlorine levels during these time periods. A series of changes to their treatment plant operations and distribution system procedures allowed the system to regain control of the water quality in the distribution system. They were able to lower the turbidity spikes to around 1.5 NTU at night and maintain more consistency in chlorine residual levels resulting in better water quality and consistency for the end consumers.
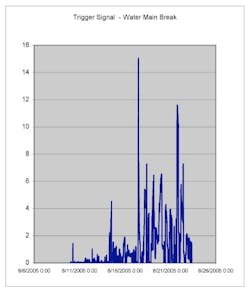
Another incident occurred on June 29th, 2006. The pipe was an 8-inch line and was located 1.8 miles down stream from the monitoring sensors. There was an increase in turbidity and chlorine. The turbidity appears to have increased the day prior to the break. A third break occurred on July 30th, 2006. The line was a 36" water main located 1 mile from the monitor. Conductivity, turbidity, and chlorine spiked. There appears to be two water flow interruptions to the WDMP the night before but it's unclear if they are related to the break on the 30th. Another break occurred at night on September 20th, 2006. The exact time of the break is currently unknown, although there appears to be a flow interruption to the monitoring panel the previous morning. The line involved was a 12" water main, which is 0.4 miles from the panel.
Aviation Fuel Incident
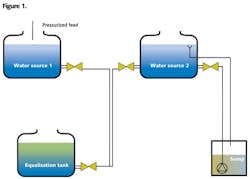
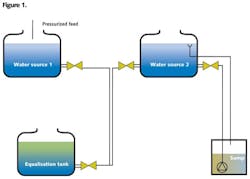
In this situation, water from a well abandoned due to contamination with aviation fuel was being used to flush out some lines that had been physically isolated from the remainder of the distribution system. Somehow, the water got by a double-valve isolation set up and contaminated a water storage unit that was being monitored. The system was isolated and customers were not exposed. See Figure 4.
Fluoride Incident
In this scenario the water utility was forced to revert to the utilization of an older water treatment plant while maintenance was being done to the new plant. A pump responsible for dosing fluoride into the treated water malfunctioned causing the dose to increase over time. In this case the monitor not only alarmed but also classified the likely cause of the problem to be a fluoride overfeed as that fingerprint was in the agent library. This allowed a rapid response before consumers were exposed to potentially dangerous levels of fluoride.
Conclusion
Extensive laboratory and pipe loop testing that is detailed in a separate papers (Kroll & King 2006; Kroll 2007), indicate that these types of monitoring systems appear to be a good choice for detecting water quality excursions that could be linked to water security events. There are a number of advantages to using such systems. The chief advantage is that these instruments are not new. They are based on common everyday parameters with which the average industry worker is quite familiar, thus, adding a degree of comfort in operations not afforded by other new technology. As existing technologies, these instruments have been proven to be robust and dependable in prior field deployments. They represent measurements that would be of interest and use to water utility personnel above and beyond their role as water security devices. The deployment incidents detailed in this paper confirm this and also demonstrate the applicability of utilizing these everyday parameters by linking them with advanced algorithms. The field deployment studies not only demonstrate robustness in the field and the ability to recognize a wide variety of events, but these studies also demonstrate such system's ability to learn. It is foreseeable that these devices will become much more than a system that is capable of detecting terrorist events. They could easily become a critical tool for improving everyday operations.
For example, through many years of experience, the best old hands at treatment plant operations have developed "a sense" for knowing something in the treatment system is amiss. It can be a smell, color, clarity (or lack thereof), sound or just tingling in the nape of the neck. One gains this sense only by extensive experience in a particular facility. These senses do not exist in distribution systems because there has typically been little measurement done upon which to gain these "senses" and, therefore "Bulk Parameter Monitoring in the Distribution System with Interpretive Algorithms" has the potential to become the artificial "sense" able to quickly "learn" the quirks of the distribution system and have those quirks labeled by those with extensive experience so that less experienced employees have the benefit of that knowledge without having to wait 5, 10 or more years. A good phrase to describe this knowledge base would be "institutional intuition." (Kroll, 2006)
With the aging of the work force and rapid employee turnover "institutional intuition" has the chance of quickly dying out. Above and beyond their obvious security benefits, algorithms could be a way to circumvent this loss of knowledge and to build a knowledge base where none has previously existed. This in turn could allow improvements is system operation that may result in cost savings and definitely will result in a higher quality product being delivered to the consumer.
References
Kroll, Dan and King, Karl. 2006. "Safeguarding the Distribution System: On-Line Monitoring for Security and Enhancing Operational Performance," Journal of the New England Water Works Association. June 2006.
Kroll, Dan. 2007. "Operational and Laboratory Verification Testing of a Heuristic On-Line Water Monitoring System for Security," International Journal of High Speed Electronics and Systems. Vol. 17, No. 4. December 2007.
Kroll, Dan. 2006. "Securing Our Water Supply: Protecting a Vulnerable Resource," PennWell Publishers. Tulsa, OK.
About the Authors
Dan Kroll, Hach Homeland Security Technologies, Loveland, CO. Email: [email protected]
Karl King, Hach Homeland Security Technologies, Loveland, CO. Email: [email protected]
###


