Integrated Decision Support System Simplifies Capital Improvement Planning
by Gregory J. Osthues, Roger Loomis, and Chris Heltzel
In March 2005, the city of Newark, Ohio, undertook a project to gain additional understanding of the city’s water and sewer systems to produce a citywide integrated asset model of those systems for Capital Improvement Planning (CIP). Conducted by the city of Newark, Harfan Technologies, InfraMetrix, LLC (Wakefield, MA) and Malcolm Pirnie’s Red Oak Consulting Division (White Plains, NY), the project used the Harfan Technologies Integrated Decision Support System software as the asset-modeling engine to develop the CIP budget.
The usefulness of any model is dependent on accurately representing physical structures within the systems. This particular asset model is dependent on: families of assets, including pipe diameter and pipe material; pipe age; current condition of the pipe; and the spatial relationship between the water and sewer pipes (proximity). It is based on data found in the Utility Department’s GIS/CMMS, supplemented by an InfraMetrix condition assessment of selected pipes. In addition to this report, results from the condition assessment and asset model are in electronic format and data has been loaded into the GIS/CMMS where appropriate.
Availability of Existing Data
The department’s GIS/CMMS includes attributes for pipe diameter, material and age. The diameter data was relatively complete for the water and sewer systems, as was the material data for the water system. The sewer data, however, initially had more than 3,000 records with blank or ‘N/A’ material and the age information was present on less than 6% of all water and sewer pipes. There were also conflicts with some pipe feature IDs and connectivity. Prior to finalizing the asset model, gaps in the feature attributes and reconciliation of feature IDs and connectivity was performed by department staff.
Collection of Additional Field Data
Condition information was available for a large portion of the sewer pipes, based on previous city CCTV inspections and the pilot project InfraMetrix condition assessment. The city identified four target areas of interest comprising 485 sewer pipes that were inspected by InfraMetrix using Zoom Camera technology. The Zoom Camera is an inspection camera system incorporating specialized lighting and lens technology to perform video inspections of buried infrastructure, both pipelines and structures. The digital video and field observations were then sent to NASSCO Pipeline Assessment and Certification Program (PACP) certified technicians to rate and rank each pipe based on the Water Research Centre (WRc) grades for Potential for Blockage and Internal Structural Condition.
Decision Support System
The Harfan model utilizes deterioration curves for each distinct family of assets. The development of these curves, which characterize the useful life of those assets, is based on material, diameter, depth, soil conditions, break history, pressure and other characteristics — depending on the availability of this data. The deterioration curves are then used to build a predictive model that will evaluate the deterioration rate of a network segment through time.
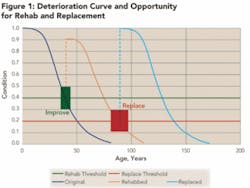
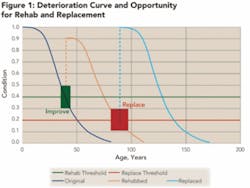
Representative deterioration curves help the city asset managers to determine windows of opportunity for various improvements, such as when to perform preventative maintenance, when to rehabilitate, or when to plan for complete reconstruction.
For example, a theoretical family of sewer pipe could have the deterioration curve shown as darker blue in Figure 1. The green line represents the condition at which rehabilitation is appropriate and the red line is when replacement should occur. By rehabilitating the sewer during the window of opportunity (green box), the service life can be significantly extended while maintaining a higher service level as represented by the orange curve. The light blue line represents the effect of replacing assets within the optimum replacement window (red box).
Based on the deterioration curves, decision tree and unit costs for rehabilitation and repair (R&R), a more viable Capital Improvement Plan can be developed for any set of assets. In reality, many assets within a sewer or water network are physically close to other assets. Therefore, performing R&R on one set of assets has the potential of disrupting other nearby assets. By looking at an integrated solution that takes into consideration multiple sets of assets, the overall capital costs for preserving those assets can be reduced. Planning rehabilitation of sewers to extend their life so that both the water and sewer systems can be replaced at the same time can save significantly on those replacement costs.
Condition Assessment Results
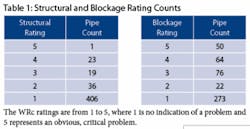
In the targeted areas, 485 sewer pipes were inspected and rated based on their structural condition and their potential for blockage (see Table 1).
The structural and blockage ratings, as well as the video and still photos, were loaded onto the city’s server and linked to the gbaMS CMMS.
The WRc ratings were translated from a 1 to 5 scale to the 1 to 0 physical condition scale used by Harfan and predicted deterioration curves were developed for the sewer and water pipe material families, respectively.
Developing Scenarios: An Integrated Approach
Three funding scenarios for both the water and sewer systems were analyzed to determine the most cost-effective approach to maintaining the systems at an acceptable condition. Each scenario covers a period of 20 years, from 2007 to 2027, and applies a target yearly budget that allows for funds to be carried over to subsequent years if any are remaining. This may result in little or no R&R some years and large spikes in others.
Individual system analysis determines when an asset will need to be replaced or repaired, without consideration of other assets in close proximity. What makes the Harfan system unique is its ability to integrate data from multiple datasets, which allowed the city to group the water and sewer structures and, by implication, the roads they were under or near.
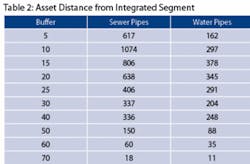
Based on their proximity to one another, the water and sewer pipes were grouped into Integrated Segments, which were represented in a GIS line layer. This layer was created by first selecting all Street Centerlines that had a water or sewer line within a 30-foot buffer. Additional Integrated Segments were added where sewer and water lines were not on or near a road. Remaining segments were grouped based on a buffer up to 70 feet from an Integrated Segment. Table 2 shows the number of pipes that are within a given buffer distance.
The result is a total of 2,347 Integrated Segments with 1,052 having at least one water and one sewer pipe, 863 segments having only sewer pipe and 432 segments having only water pipe. Water and sewer assets having the same Integrated Segment ID will be considered for coordinated repair or replacement anytime that they are both due within the specified window of opportunity.
The three integrated funding scenarios were based on different funding levels and windows of opportunity and cover the same 20-year period as the individual system analysis. The total cost and net present value have been calculated for the total funding over the 20-year period. Details of the three scenarios follow.
Integrated Scenario A
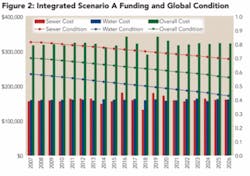
Scenario A targets the $160,000 yearly funding level that Newark has used in recent years for water and sewer ($320,000 total). This is a Just-In-Time (JIT) scenario using a one-year window of opportunity in which to perform the recommended R&R. The JIT option tends to predict the lowest R&R cost because the model waits until each asset has reached the end of its useful life.
The results (see Fig. 2) show that the total funding over 20 years ($6,393,000) is almost equal to 20 × $320,000 = $6,400,000, indicating that additional R&R could be necessary, but that there was not enough funding.
Integrated Scenario B
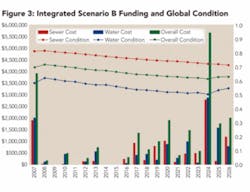
Scenario B does not set a limiting budget and thus is an idealized scenario in which all R&R is performed regardless of cost. This scenario is useful in showing how much overall work is really needed. This is also a JIT scenario with a single year as the window of opportunity for R&R.
This scenario (see Fig. 3) shows a need for $542,050 per year for sewer and $603,500 per year for water on average. This represents approximately 3.5 times the current budget. It shows that a substantial amount of work should be completed soon, followed by a lull and then an increasing amount of work in the second 10 years. The overall initial sewer condition is fairly high (0.81), so even with unlimited funding in a JIT scenario, the overall condition will drop, but not a far as in Scenario A. The overall water condition increases then slowly drops and finishes with an upturn close to its starting condition.
Integrated Scenario C
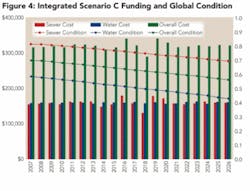
While the JIT Scenarios A and B provide a reality check that compares current funding to an ideal unlimited funding, Scenario C is intended to provide a realistic budget that will begin to more proactively address the city’s deteriorating infrastructure (see Fig. 4). This moderately aggressive scenario allocates $300,000 each to water and sewer for a total budget of $600,000 per year. This scenario also extends the window of opportunity from one year to five years. The benefit of a larger window is twofold: first, there is less likelihood of assets failing prior to their scheduled maintenance date; second, the opportunity to coordinate maintenance is increased because there are more integrated segments where both the water and sewer are due for maintenance within a five-year window than there are within a one-year window. This reduces the overall cost and minimizes public discontent when a road is torn up for sewer maintenance only to have water maintenance occur within a couple years. A larger window of opportunity does, however, increase the potential for an asset to be repaired sooner than necessary.
Conclusions
The current funding level of $160,000 each for water and sewer rehabilitation and repair is not sufficient to stay ahead of the deteriorating infrastructure. Integrated Scenario B shows that there is over $4,500,000 in R&R that should ideally be performed over the next five years. This is a daunting task but by prioritizing the list of assets based on criticality, a manageable schedule can be achieved. In the short-term, increasing the R&R budget to $300,000 per year for water and for sewer, respectively, will allow the city to start addressing the critical infrastructure.
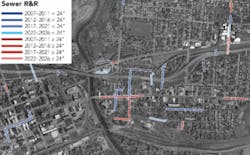
Based on Integrated Scenario C, there are 181 sewer pipe segments expected to be rehabilitated or replaced over the next 20 years. Of these sewer pipes, 41 have a diameter of 24" or greater, which would be considered a higher criticality. Based on the same scenario, there are 235 water pipe segments expected to be replaced over the next 20 years. Of these water pipes, 27 have a diameter of 12" or greater, which would be considered a higher criticality. Figure 5 shows a map of sewer infrastructure to be replaced based on five-year periods and pipe size.
The city has begun to use the model results to schedule R&R. An initial benefit was seen when the City Street Department presented its 2007 paving and reconstruction plan. The Utility department decided not to replace existing sewer and water lines as part of a major reconstruction project because the life of the new asphalt was less than the remaining life of the pipe under the street. Previously this decision would have been much more subjective and would have leaned toward replacement of the buried infrastructure during street repairs.
Looking Ahead
Having this structured model with graphed results and mapped output is instrumental for explaining the CIP plan and garnering community support. The plans are now based on a proactive approach that looks to the future, rather than looking at past plans with an inflation factor.
The city will be able to track unplanned maintenance over time and compare this data to the model results. Further, the model can be recalibrated as necessary with additional break history and condition assessment information to refine the results.
About the Authors:
- Gregory J. Osthues, P.E., is a senior associate with Red Oak Consulting, a division of Malcolm Pirnie.
- Roger Loomis is the utilities director for the city of Newark, OH.
- Chris Heltzel is a principal consultant with Red Oak Consulting, a division of Malcolm Pirnie.
