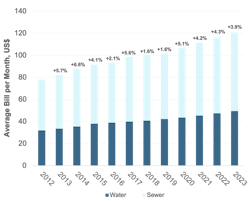
Typical household water, sewer bills increased 56% since 2012

Correction Notice: A previous release of Bluefield’s water rate analysis incorrectly captured the billing frequency of water rates for Portland, OR as monthly instead of quarterly billing for the 2022 and 2023 rate schedule inputs. Additionally, the New York, NY minimum daily charge was incorrectly classified as a base charge. Both errors caused the total estimated water bills to be higher than they are, impacting the last two years of data. Both errors have been corrected in this version.
Bluefield Research has announced some of the findings in its new report on water and sewer utility rates in U.S. households.
Bluefield Research has for the eighth consecutive year engaged in a comprehensive analysis of water and sewer rates for 50 of the largest cities that provide services to 15% of the U.S. population. The combined water and sewer bill for a typical U.S. household has increased by 54.8% since 2012, or 4.1% annually, according to the report, U.S. Municipal Water & Sewer: Annual Utility Rate Index, 2023.
Across 50 of the largest U.S. metropolitan areas, average monthly household water bills increased to USD $49.53, and monthly sewer bills reached $71.16, based on average household water consumption.
Two cities demonstrating the largest rate increases from 2022–2023 were El Paso, Texas and San Jose, California. El Paso residents recorded an 8% increase in their water and sewer rates to secure future water supplies. In San Jose, California, residents saw a 12% increase due to the utilities’ rising costs for purchased water, drought conditions, and planned infrastructure projects. Among the 50 cities analyzed, eight reported rate declines in 2023.
“While the reasons for rate increases vary city by city, many have been in response to rising costs (i.e., inflation, labor) for ongoing system operations and maintenance, along with large capital investments to address aging infrastructure,” noted Charlie Suse, Senior Analyst at Bluefield Research. “Across the board, higher costs for labor, chemicals, and materials have been among the most cited reasons for water utility rate increases."
At a local level, the differences become more apparent. Monthly water bills range from a low of US$19.51 in San Antonio, Texas, to a high of US$114.25 in San Francisco, California. Whereas monthly sewer bills range from a low of US$11.24 in Long Beach, California, to a high of US$170.40 in Seattle, Washington.
Bluefield’s analysis highlights new programs targeting drought resiliency in California, as well as debt services for capital programs in Detroit, Michigan, and Washington, D.C. that are driving up rates in the near term. In the wake of the COVID-19 pandemic and the end of rate relief programs, cities like Riverside, California, have implemented and resumed new rate schedules after several years of postponements.
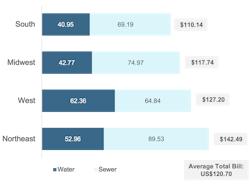
“Utilities in the Western U.S. rely more heavily on seasonal rate structures to help stabilize revenues and encourage conservation, particularly in Los Angeles, California and Phoenix, Arizona,” says Suse.“ In 2023, households in the Northeast faced the highest average combined water and sewer bills, with an average combined monthly bill of US$142.49. This is in part due to the scale of operations and maintenance (O&M) and energy prices.”
Overall, the financial dynamics of water utilities have been changing. The combination of rising capital expenditure (CAPEX), surging operating expenditure (OPEX), and a decrease in federal spending for water infrastructure have created challenges for water utilities. To address aging infrastructure and escalating financial requirements, many utilities have had to pass on increases to their ratepayers.
Amid rising household water and sewer rates, affordability looms large for all utilities and city managers. In many cases, utilities have implemented assistance programs for low-income or elderly resident households, including the cities of Albuquerque, Austin, Seattle, Omaha, Columbus, and Memphis.