A new survey from EurEau brings together the latest data on drinking water and wastewater services across Europe. How have things changed over eight years?
It was originally in 2009 when EurEau’s (European Federation of National Associations of Drinking Water Suppliers and Wastewater Services) data survey on drinking water and wastewater in Europe was first presented. The survey includes national technical and economic data, ranging from population connection rates to drinking water supply. Eight years later and the results from a revised survey have been published.
“A lot has changed in the intervening eight years,” says Bruno Tisserand, president of EurEau. “Technology is improving, innovation is increasing and consumers are demanding more environmentally sound and cost effective services.”
In total, data was collected from 29 member states across Europe, from Austria to Slovakia.
However, EurEau issues a word of caution: “These very different national circumstances do not allow for simple comparisons between countries. Substantial differences can also occur within countries, depending on the local conditions.”
Investment and tariffs
Annually, European water services invest approximately €45 billion in water infrastructure, suggesting that €93.5 is invested per inhabitant, per year. Such investment is financed mainly through taxes, transfers and tariffs. For the latter, the average annual water utility bill across Europe came in at just under €400. Norway and Denmark reported the highest average bill at just over €800 and €700, respectively.
“Water tariffing is a complex topic as they depend on multiple parameters like tax level, water sources (groundwater usually requires less treatment than surface water), length of network per inhabitant, receiving water (sensitive areas require a higher level of treatment for wastewater,” says EurEau.
The federation warns that while the averages are “useful in evaluation the global diversity of prices across Europe” that a “direct comparison of water bills or the price per cubic metre between countries is not possible”.
Drinking water services
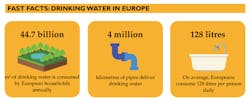
The total length of the drinking water network in Europe is 4.2 million kilometres – estimated at eleven times the distance from the Earth to the Moon. This network supplies 44.7 billion m3/year of drinking water. In terms of drinking water sources, surface water and groundwater, including spring water, continue to provide the majority.
Desalination only comes into the equation in Cyprus, Greece, Spain and makes up over half the supply in Malta. When it comes to consumption, the average consumption for member countries is 128 litres per inhabitant per day. Meanwhile, the average household composition is 2.3 inhabitants and the average consumption is 111 m3/household/year.
Wastewater services and sludge management
The total length of the sewer network across the EU has been estimated at around three million kilometres. In total, there are more than 18,000 wastewater treatment plants across the continent.
It should be noted that the total treatment capacity in the EU has to be bigger than the actual population in order to anticipate the “changes occurring over the lifetime of the wastewater treatment plants and to take into account the industrial pollution load if they are authorised by local authorities”.
EurEau adds: “Few countries collect data on the proportion of combined and separate sewers so the collected data represents the aggregated value for all types of sewers.” Interestingly, when it comes to the level of wastewater treatment, across Europe a total of 3.1 percent of the load is treated at primary level, 28.5 percent at secondary level and 68.4 percent at a tertiary level. Although tertiary treatment is not defined in the Urban Wastewater Treatment Direction (UWWTD), it’s often used for “more stringent treatment than secondary treatment”, according to the report.
For the destination of sewage sludge, agriculture remained the highest at 49.2 percent, with incineration coming up second at 24.9 percent. This was followed by land reclamation and landfill, at 12.4 percent and 8.7 percent respectively. The data was obtained by summing up the weight of sewage sludge over the responding countries. However, the data does not include Austria, Bulgaria, Croatia, Denmark, Ireland, Serbia and Switzerland.
Overall, 95 percent of people living in Europe have access to clean drinking water while have wastewater returned to the environment in a safe manner.
The next challenge lies not in connecting new people, but operation, maintenance and rehabilitation of the existing assets.
For more information and to read a copy of the report, visit: www.eureau.org.
More Water & WasteWater International Archives Issue Articles


